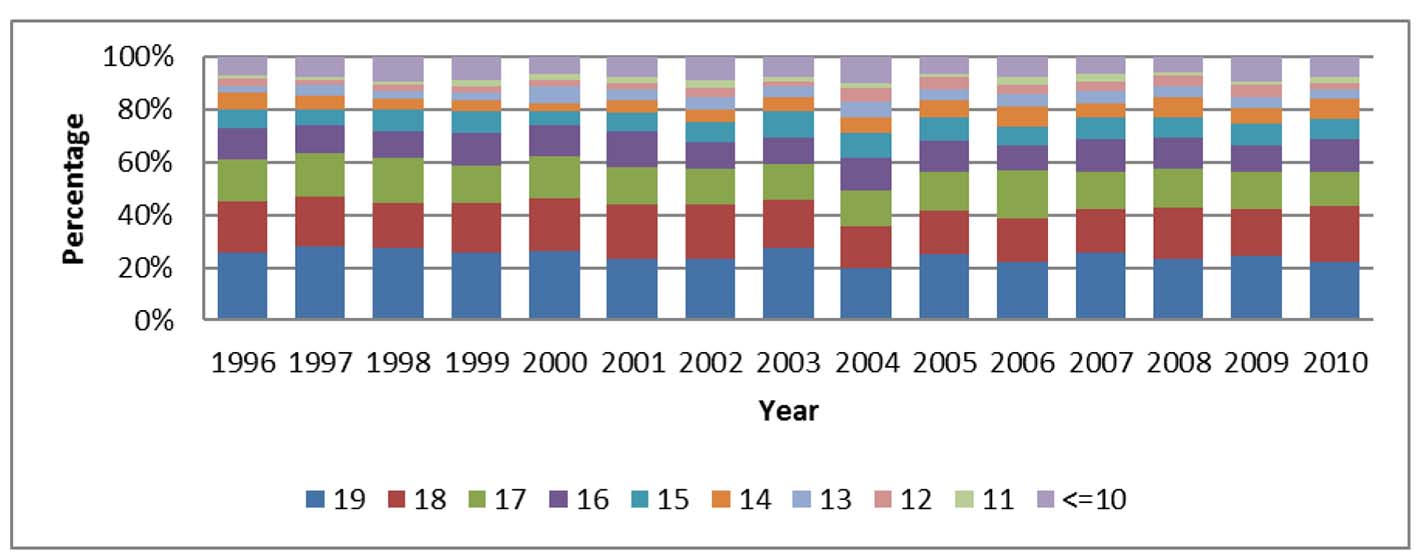
Figure 1. Age distribution in patients under the age of 20 years with gallstones (GSU20).
| Journal of Clinical Medicine Research, ISSN 1918-3003 print, 1918-3011 online, Open Access |
| Article copyright, the authors; Journal compilation copyright, J Clin Med Res and Elmer Press Inc |
| Journal website http://www.jocmr.org |
Original Article
Volume 9, Number 2, February 2017, pages 117-123
Symptomatic Gallstones in the Young: Changing Trends of the Gallstone Disease-Related Hospitalization in the State of New York: 1996 - 2010
Figures
Tables
| Year | (AD)i | (AD-female)i-f | (U20)ii | (GS)iii | (GSF)iii-f | (GSU20)iv | (GSU20:GS)v |
|---|---|---|---|---|---|---|---|
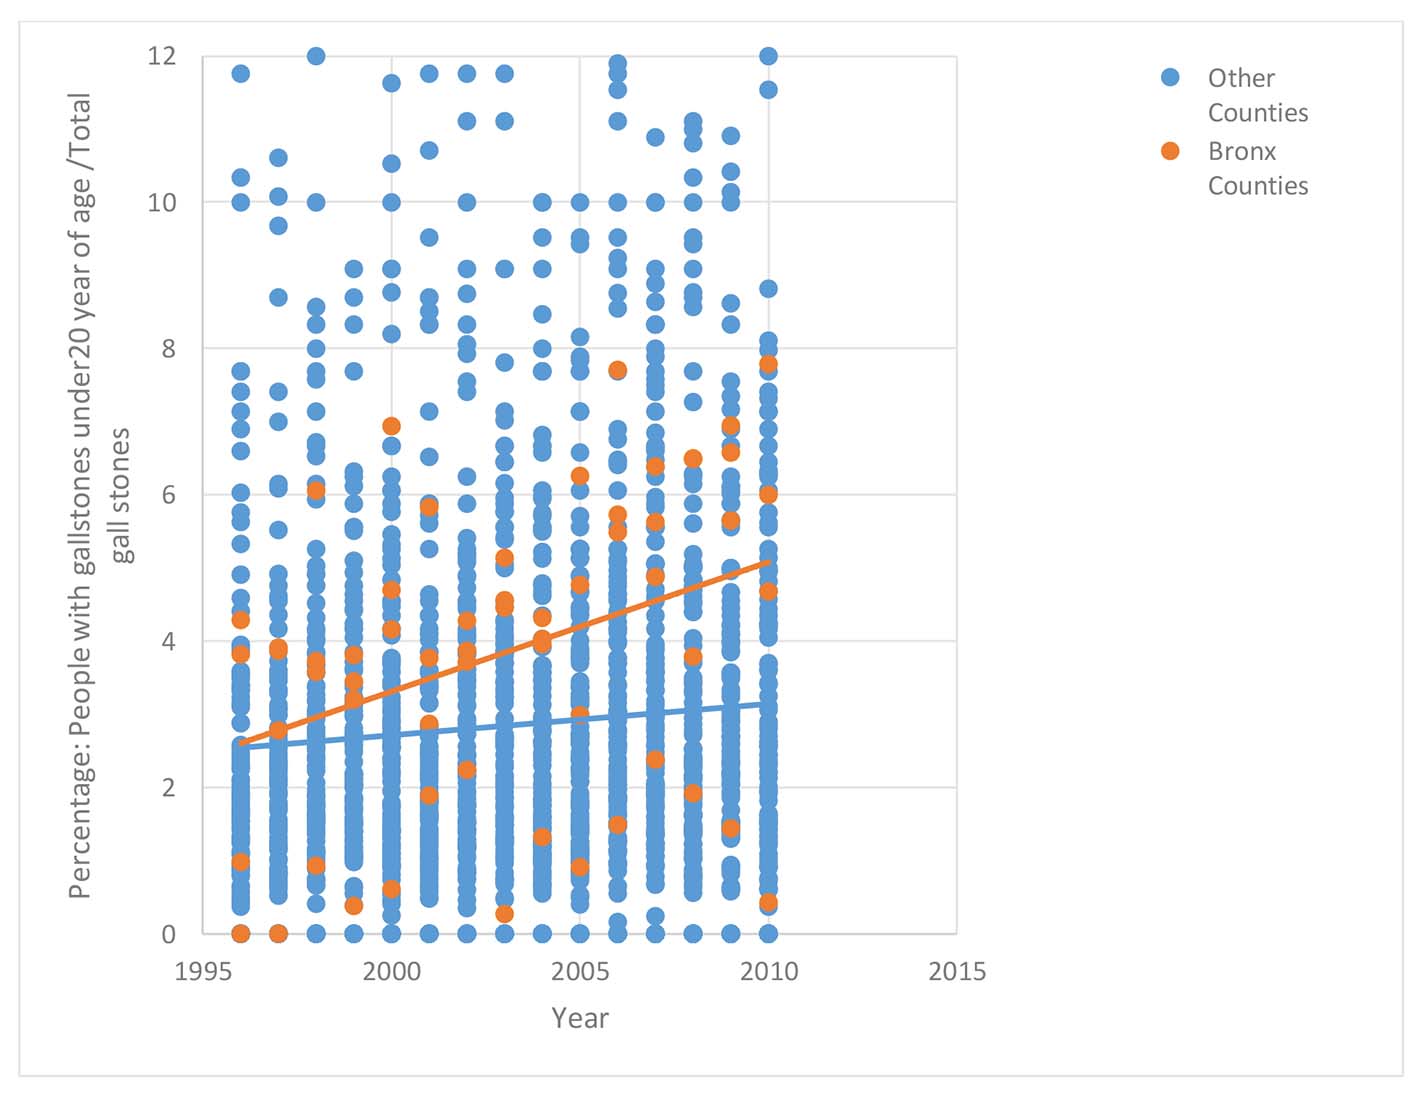
| Also refer to study acronyms section. iAD: All discharges irrespective of the age, gender and ICD codes of the discharge diagnoses. i-fAD-female: All female discharges irrespective of the age ICD codes of the discharge diagnoses. iiU20: All discharges among patients younger than 20 years, irrespective of gender and ICD codes of the discharge diagnoses. iiiGS: All patients with a discharge diagnosis of gallstone disease. iii-fGSF: All female patients with a discharge diagnosis of gallstone disease. ivGSU20: All patients younger than 20 years and with a discharge diagnosis of gallstone disease. vPercentage of gallstone disease in the young (no. of patients aged < 20 years with gallstone disease/total no. patients with gallstone disease). | |||||||
| 1996 | 2,472,582 | 1,420,645 | 177,572 | 42,911 | 30,245 | 877 | 2.04% |
| 1997 | 2,436,953 | 1,398,620 | 170,473 | 38,982 | 27,457 | 822 | 2.11% |
| 1998 | 2,449,696 | 1,407,077 | 163,528 | 37,512 | 26,396 | 826 | 2.20% |
| 1999 | 2,473,309 | 1,417,316 | 165,894 | 35,833 | 24,951 | 779 | 2.17% |
| 2000 | 2,549,654 | 1,460,678 | 163,898 | 36,063 | 25,132 | 781 | 2.17% |
| 2001 | 2,574,758 | 1,470,400 | 164,071 | 35,596 | 24,375 | 716 | 2.01% |
| 2002 | 2,617,203 | 1,493,780 | 160,598 | 35,691 | 24,470 | 792 | 2.22% |
| 2003 | 2,696,049 | 1,536,120 | 164,333 | 35,487 | 24,039 | 863 | 2.43% |
| 2004 | 2,741,495 | 1,556,981 | 162,852 | 35,507 | 23,880 | 853 | 2.40% |
| 2005 | 2,752,209 | 1,554,004 | 161,043 | 35,041 | 23,583 | 813 | 2.32% |
| 2006 | 2,771,579 | 1,563,127 | 160,628 | 35,411 | 23,726 | 960 | 2.71% |
| 2007 | 2,783,498 | 1,571,481 | 159,569 | 35,033 | 23,194 | 1008 | 2.88% |
| 2008 | 2,809,306 | 1,581,626 | 154,745 | 34,100 | 22,476 | 921 | 2.70% |
| 2009 | 2,822,537 | 1,582,478 | 158,069 | 34,330 | 22,448 | 998 | 2.91% |
| 2010 | 2,779,695 | 1,557,397 | 148,471 | 33,612 | 22,157 | 997 | 2.97% |
| Year | All hospitalized patienta in Bronx | Bronx - gallstone admission | Bronx - under the age of 20 | |||||||||
|---|---|---|---|---|---|---|---|---|---|---|---|---|
| Blacks | Hispanics | Whites | Others | Blacks | Hispanic | Whites | Others | Blacks | Hispanic | Whites | Others | |
| 1996 | 23% | 26% | 17% | 34% | 14% | 34% | 33% | 33% | 22% | 35% | 5% | 39% |
| 1997 | 19% | 21% | 10% | 49% | 10% | 26% | 54% | 54% | 14% | 35% | 0% | 51% |
| 1998 | 18% | 20% | 9% | 53% | 8% | 25% | 59% | 59% | 14% | 26% | 2% | 58% |
| 1999 | 17% | 22% | 10% | 51% | 10% | 26% | 55% | 55% | 10% | 25% | 1% | 64% |
| 2000 | 20% | 21% | 11% | 48% | 11% | 24% | 53% | 53% | 19% | 27% | 2% | 53% |
| 2001 | 21% | 22% | 10% | 47% | 12% | 25% | 53% | 53% | 21% | 28% | 6% | 45% |
| 2002 | 21% | 24% | 11% | 45% | 13% | 25% | 52% | 52% | 13% | 24% | 6% | 57% |
| 2003 | 23% | 31% | 14% | 32% | 16% | 36% | 33% | 33% | 17% | 45% | 1% | 37% |
| 2004 | 24% | 32% | 13% | 31% | 16% | 36% | 33% | 33% | 18% | 42% | 5% | 35% |
| 2005 | 24% | 35% | 13% | 28% | 16% | 41% | 30% | 30% | 18% | 59% | 3% | 21% |
| 2006 | 24% | 39% | 12% | 24% | 15% | 47% | 25% | 25% | 21% | 50% | 4% | 25% |
| 2007 | 28% | 40% | 12% | 20% | 18% | 48% | 21% | 21% | 19% | 57% | 6% | 18% |
| 2008 | 30% | 40% | 13% | 17% | 19% | 51% | 18% | 18% | 23% | 60% | 4% | 12% |
| 2009 | 31% | 39% | 12% | 17% | 21% | 50% | 18% | 18% | 25% | 55% | 3% | 17% |
| 2010 | 31% | 39% | 12% | 18% | 21% | 49% | 20% | 20% | 21% | 63% | 1% | 16% |