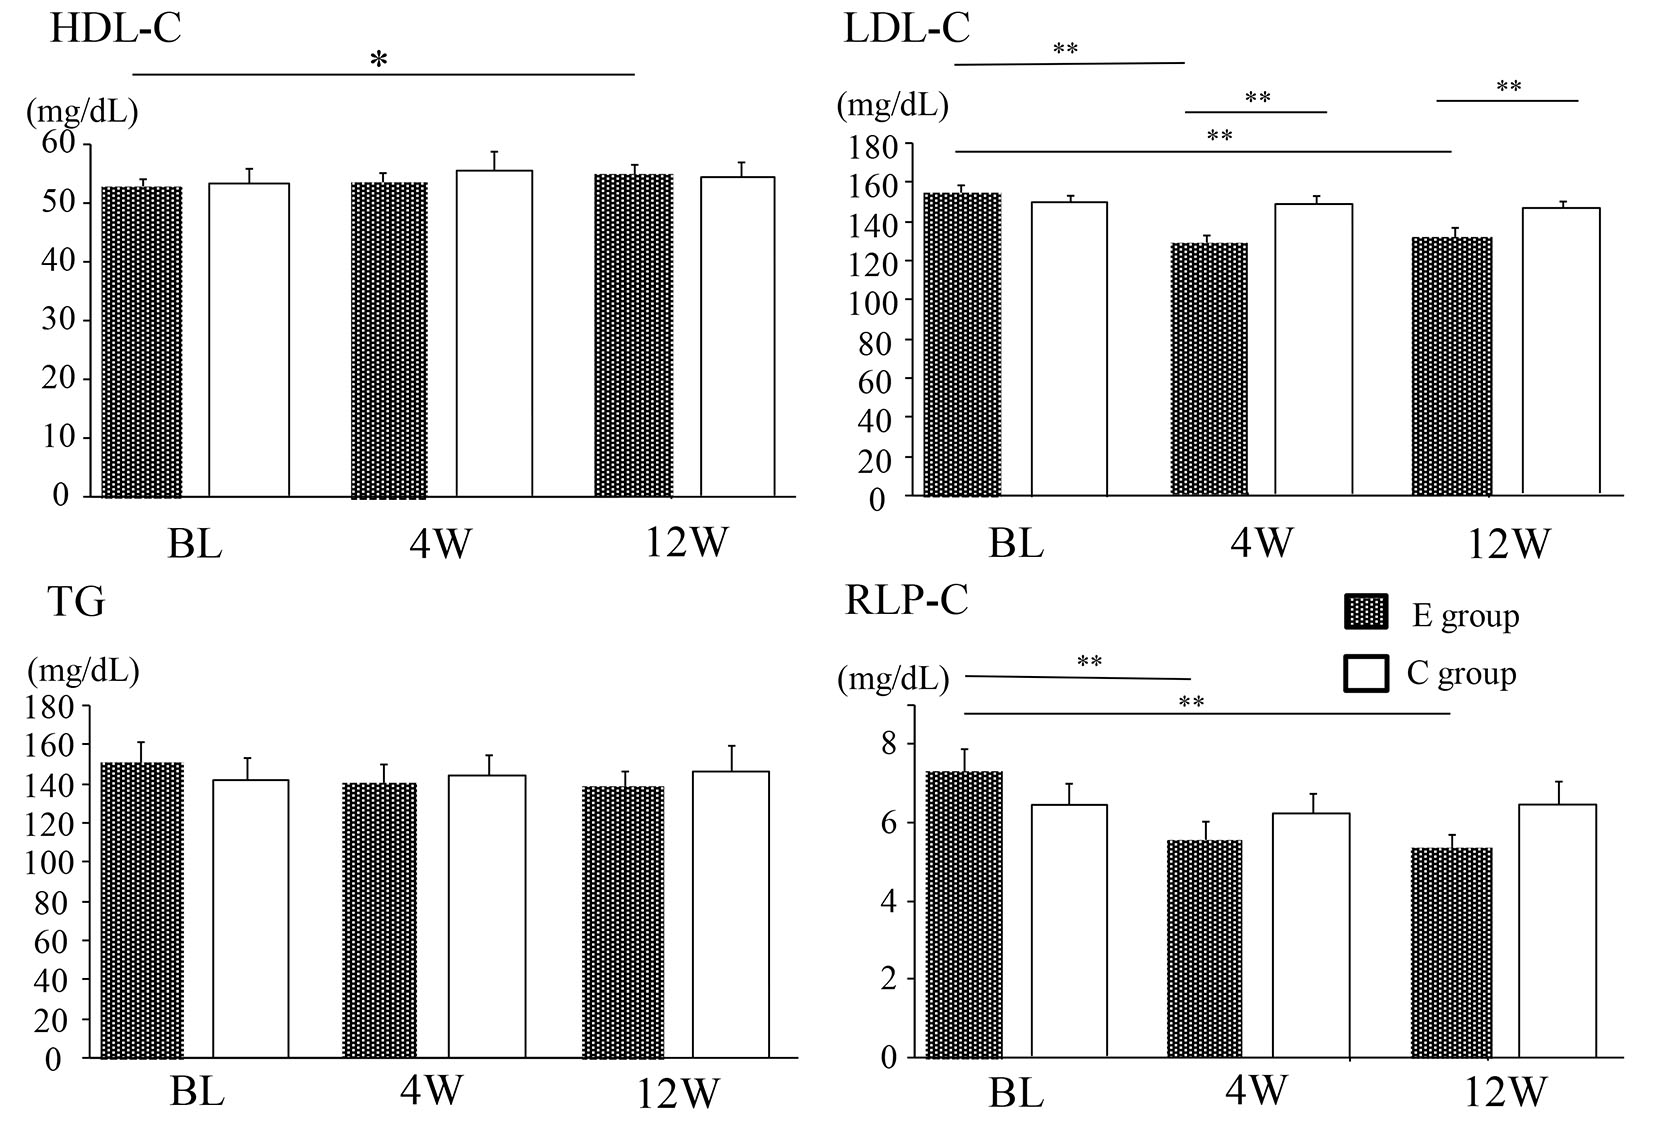
Figure 1. Changes of the lipid profile in the E group and C group. Data are shown as the mean ± SE. BL: baseline. *P < 0.05, **P < 0.01. E group: ezetimibe treated group. C group: ezetimibe non-treated control group.
| Journal of Clinical Medicine Research, ISSN 1918-3003 print, 1918-3011 online, Open Access |
| Article copyright, the authors; Journal compilation copyright, J Clin Med Res and Elmer Press Inc |
| Journal website http://www.jocmr.org |
Original Article
Volume 9, Number 6, June 2017, pages 476-481
Effect of Ezetimibe Monotherapy on Low-Density Lipoprotein Cholesterol and on Markers of Cholesterol Synthesis and Absorption in Japanese Patients With Hypercholesterolemia
Figures
Tables
| E group | C group | P-value | |
|---|---|---|---|
| Results are expressed as the mean ± SE. E group: ezetimibe treated group. C group: ezetimibe non-treated control group. BMI: body mass index; FPG: fasting plasma glucose; HbA1c: hemoglobin A1c; GA: glycated albumin; HDL-C: high-density lipoprotein cholesterol; LDL-C: low-density lipoprotein cholesterol; TG: triglycerides; RLP-C: remnant-like particles cholesterol. | |||
| Gender (male/female) | 44 (18:26) | 32 (17:15) | 0.35 |
| Age (years) | 59.3 ± 2.1 | 62.6 ± 2.2 | 0.28 |
| BMI (kg/m2) | 28.1 ± 1.1 | 27.4 ± 0.6 | 0.59 |
| FPG (mg/dL) | 105 ± 3 | 108 ± 4 | 0.53 |
| HbA1c (%) | 5.5 ± 0.1 | 5.6 ± 0.1 | 0.68 |
| AST (mg/dL) | 24.6 ± 1.5 | 22.3 ± 1.1 | 0.25 |
| ALT (mg/dL) | 27.8 ± 3.4 | 24.8 ± 2.8 | 0.53 |
| Creatinine (mg/dL) | 0.7 ± 0.0 | 0.7 ± 0.0 | 0.58 |
| TG (mg/dL) | 150.7 ± 10.8 | 141.3 ± 11.2 | 0.55 |
| HDL-C (mg/dL) | 52.8 ± 1.3 | 54.1 ± 2.3 | 0.60 |
| LDL-C (mg/dL) | 154.6 ± 3.9 | 152.5 ± 3.7 | 0.71 |
| RLP-C (mg/dL) | 7.3 ± 0.6 | 6.4 ± 0.5 | 0.28 |
| Lathosterol (μg/mL) | 4.2 ± 0.3 | 4.2 ± 0.3 | 0.95 |
| Campesterol (μg/mL) | 5.7 ± 0.4 | 5.6 ± 0.4 | 0.88 |
| Sitosterol (μg/mL) | 3.2 ± 0.2 | 3.1 ± 0.2 | 0.65 |
| E group | P-value (vs. baseline) | C group | P-value (vs. baseline) | P-value (E group vs. C group at 12 weeks) | |||
|---|---|---|---|---|---|---|---|
| Baseline | 12 weeks | Baseline | 12 weeks | ||||
| Results are expressed as the mean ± SE. E group: ezetimibe treated group. C group: ezetimibe non-treated control group. | |||||||
| HDL-C (mg/dL) | 52.8 ± 1.3 | 54.7 ± 1.5 | < 0.05 | 54.1 ± 2.3 | 55.0 ± 2.7 | 0.44 | 0.93 |
| LDL-C (mg/dL) | 154.6 ± 3.9 | 131.7 ± 3.9 | < 0.01 | 152.5 ± 3.7 | 147.2 ± 3.2 | 0.18 | < 0.01 |
| TG (mg/dL) | 150.7 ± 10.8 | 139.0 ± 7.4 | 0.20 | 141.3 ± 11.2 | 146.4 ± 12.5 | 0.61 | 0.60 |
| RLP-C (mg/dL) | 7.3 ± 0.6 | 5.3 ± 0.3 | < 0.01 | 6.4 ± 0.5 | 6.5 ± 0.6 | 0.95 | 0.08 |
| Lathosterol (μg/mL) | 4.2 ± 0.3 | 4.6 ± 0.2 | < 0.01 | 4.2 ± 0.3 | 4.5 ± 0.5 | 0.41 | 0.79 |
| Campesterol (μg/mL) | 5.7 ± 0.4 | 3.1 ± 0.2 | < 0.01 | 5.6 ± 0.4 | 5.9 ± 0.4 | 0.36 | < 0.01 |
| Sitosterol (μg/mL) | 3.2 ± 0.2 | 1.8 ± 0.1 | < 0.01 | 3.1 ± 0.2 | 3.3 ± 0.2 | 0.26 | < 0.01 |
| High responder group | Low responder group | P-value | |
|---|---|---|---|
| Results are expressed as the mean ± SE. High responder group: equal or more than 20 mg/dL LDL-C reduction. Low responder group: less than 20 mg/dL LDL-C reduction. | |||
| n | 18 | 26 | |
| Age (years) | 61.8 ± 2.7 | 57.8 ± 2.9 | 0.36 |
| BMI (kg/m2) | 27.0 ± 1.9 | 28.1 ± 1.5 | 0.41 |
| FPG (mg/dL) | 102 ± 5 | 106 ± 4 | 0.49 |
| HDL-C (mg/dL) | 53.4 ± 2.0 | 52.3 ± 1.7 | 0.69 |
| LDL-C (mg/dL) | 163.1 ± 4.0 | 148.7 ± 5.7 | 0.07 |
| RLP-C (mg/dL) | 6.8 ± 0.8 | 7.6 ± 0.8 | 0.49 |
| Lathosterol (μg/mL) | 4.2 ± 0.3 | 4.2 ± 0.4 | 0.98 |
| Campesterol (μg/mL) | 6.6 ± 0.7 | 5.1 ± 0.4 | 0.04 |
| Sitosterol (μg/mL) | 3.8 ± 0.5 | 2.8 ± 0.2 | 0.04 |