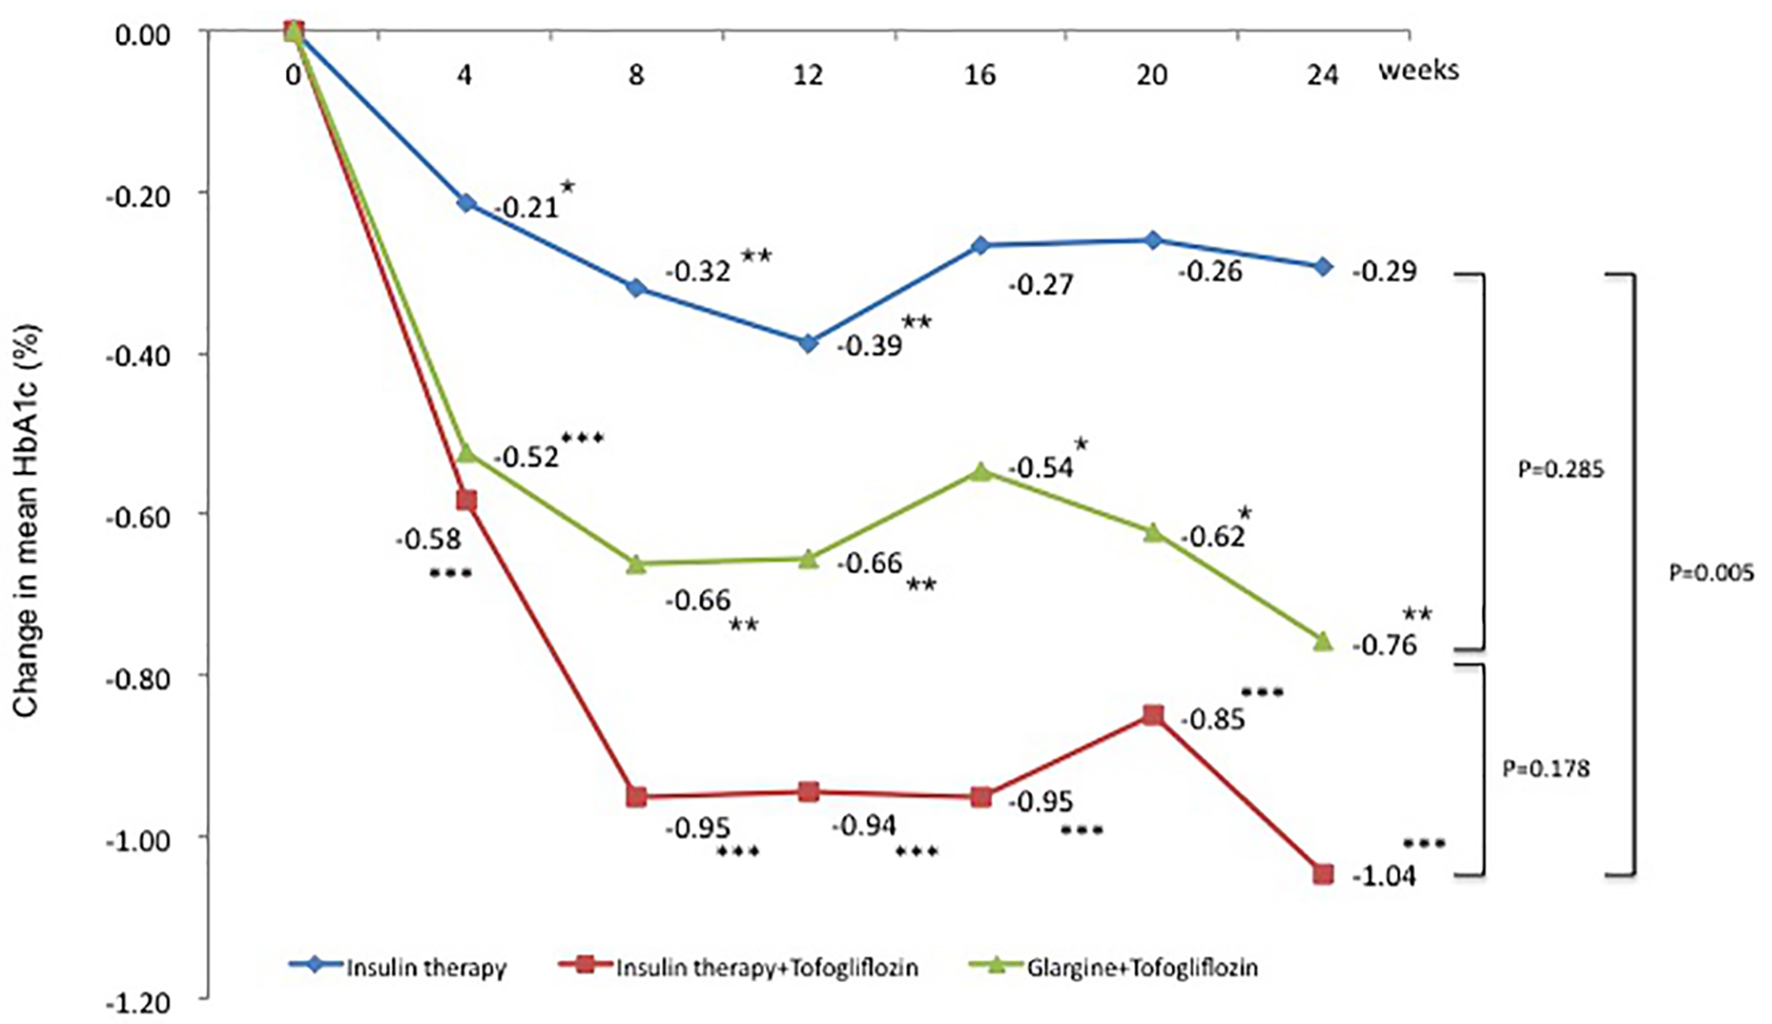
| Journal of Clinical Medicine Research, ISSN 1918-3003 print, 1918-3011 online, Open Access |
| Article copyright, the authors; Journal compilation copyright, J Clin Med Res and Elmer Press Inc |
| Journal website http://www.jocmr.org |
Original Article
Volume 8, Number 11, November 2016, pages 805-814
Comparison of Combined Tofogliflozin and Glargine, Tofogliflozin Added to Insulin, and Insulin Dose-Increase Therapy in Uncontrolled Type 2 Diabetes
Figures


Tables
| Mean pre-breakfast glucose value and/or mean pre-dinner glucose value (mg/dL) | Adjustment of basal insulin or mixed insulin dose (units) |
|---|---|
| Bolus insulin dose adjusted at discretion of treating physician only if no episodes of severe hypoglycemia. Outpatient visits every 2 weeks for first few months in the insulin + tofogliflozin group and glargine + tofogliflozin group. | |
| ≤ 56 | -4 |
| 56 - 80 | -2 |
| 81 - 110 | No adjustment |
| 111 - 126 | 1 |
| 127 - 144 | 2 |
| 145 - 162 | 3 |
| ≥ 163 | ≥ 4 |
| Insulin (n = 15) | Insulin + tofogliflozin (n = 19) | Glargine + tofogliflozin (n = 19) | |
|---|---|---|---|
| n: number of patients in the full analysis set. BMI: body mass index; OAD: oral antidiabetic drug; SD: standard deviation; SBP: systolic blood pressure; DBP: diastolic blood pressure. All characteristics were balanced across the randomized groups at baseline. | |||
| Mean age (SD), years | 62.0 (10.1) | 54.1 (11.5) | 56.6 (12.5) |
| Male, n (%) | 10 (66.6) | 10 (52.6) | 8 (42.1) |
| Mean weight (SD), kg | 69.8 (15.6) | 83.6 (20.5) | 79.2 (22.1) |
| Mean BMI (SD), kg/m2 | 26.2 (3.9) | 30.2 (5.1) | 29.2 (7.0) |
| Mean duration of type 2 diabetes (SD), years | 17.2 (8.3) | 12.7 (4.2) | 15.3 (5.9) |
| Mean duration of insulin treatment (SD), years | 7.1 (3.3) | 6.8 (2.8) | 6.9 (4.8) |
| Insulin regimen, n (%) | |||
| Basal | 1 (6.6) | 2 (10.5) | 0 (0.0) |
| Mix | 13 (86.6) | 11 (57.9) | 12 (63.1) |
| Bolus + basal | 1 (6.6) | 6 (31.6) | 7 (36.8) |
| Mean total insulin dose (SD), U | 35.9 (16.0) | 42.2 (23.1) | 39.9 (12.1) |
| Background OAD, n (%) | |||
| Sulphonylurea | 2 (13.3) | 5 (26.3) | 4 (21.0) |
| DPP4 inhibitor | 7 (46.6) | 8 (42.1) | 10 (52.6) |
| Metformin | 10 (66.6) | 11 (57.9) | 15 (78.9) |
| Others | 1 (6.7) | 0 (0.0) | 0 (0.0) |
| Mean HbA1c (SD), % | 8.1 (0.3) | 9.0 (1.2) | 8.8 (0.9) |
| Mean fasting plasma glucose (SD), mg/dL | 165.0 (16.6) | 185.5 (24.6) | 171.9 (24.1) |
| Concomitant medications, n (%) | |||
| Antihypertensive agents | 11 (73.3) | 10 (52.6) | 15 (78.9) |
| Lipid-lowering agents | 9 (60.0) | 13 (68.4) | 13 (68.4) |
| Acetylsalicylic acid | 1 (6.6) | 1 (5.2) | 0 (0.0) |
| Mean eGFR (SD), mL/min/1.73 m2 | 85.3 (23.1) | 89.4 (34.6) | 91.7 (29.3) |
| Mean SBP (SD), mm Hg | 126.4 (9.5) | 127.5 (13.7) | 130.5 (5.9) |
| Mean DBP (SD), mm Hg | 74.3 (12.9) | 76.4 (13.3) | 74.6 (10.3) |
| Mean total cholesterol (SD), mg/dL | 173.3 (20.0) | 179.1 (25.3) | 180.6 (26.8) |
| Mean triglycerides (SD), mg/dL | 147.8 (72.2) | 166.6 (114.4) | 152.9 (55.8) |
| Mean LDL cholesterol (SD), mg/dL | 102.2 (19.2) | 103.2 (17.3) | 108.6 (24.2) |
| Mean HDL cholesterol (SD), mg/dL | 54.5 (12.5) | 54.0 (12.5) | 54.5 (10.1) |
| Insulin (n = 15) | Insulin + tofogliflozin (n = 19) | Glargine + tofogliflozin (n = 19) | |
|---|---|---|---|
| n: number of patients in the full analysis set. BMI: body mass index; OAD: oral antidiabetic drug; SD: standard deviation; SBP: systolic blood pressure; DBP: diastolic blood pressure. | |||
| HbA1c, % | |||
| Baseline (SD) | 8.1 (0.3) | 9.0 (1.2) | 8.8 (0.9) |
| Adjusted mean change from baseline (95% CI; P-value) | -0.3 (-0.60 to 0.02; 0.062) | -1.0 (-1.49 to -0.59; 0.0001) | -0.8 (-1.28 to -0.22; 0.008) |
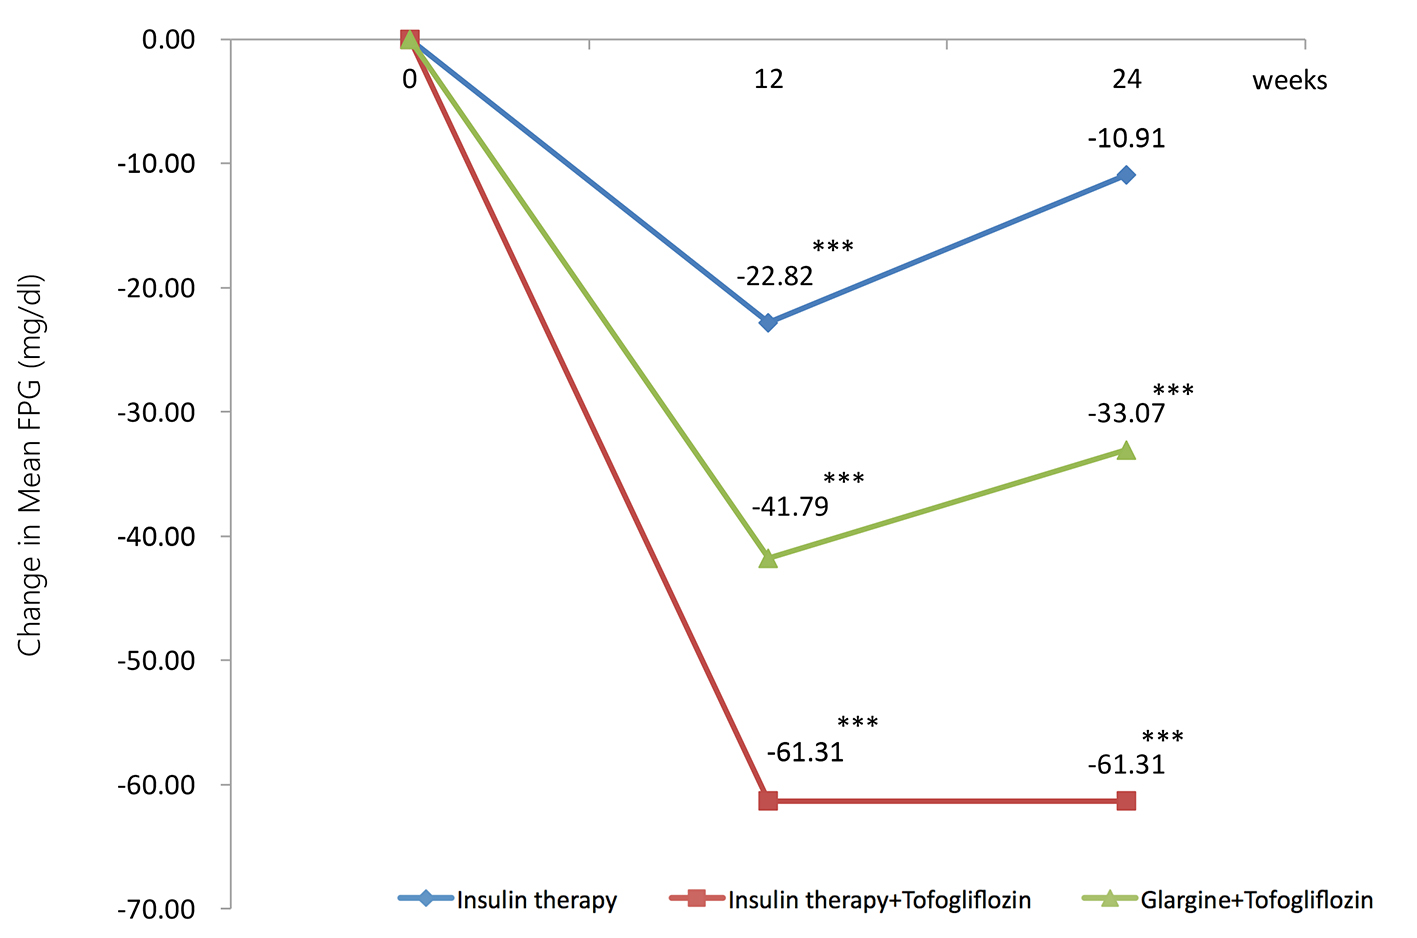
| Fasting plasma glucose, mg/dL | |||
| Baseline (SD) | 165.0 (16.6) | 185.5 (24.6) | 171.9 (24.1) |
| Adjusted mean change from baseline (95% CI; P-value) | -10.9 (-20.9 to -0.87; 0.0359) | -61.3 (-81.86 to -39.76; < 0.0001) | -33.1 (-46.41 to -19.73; 0.0001) |
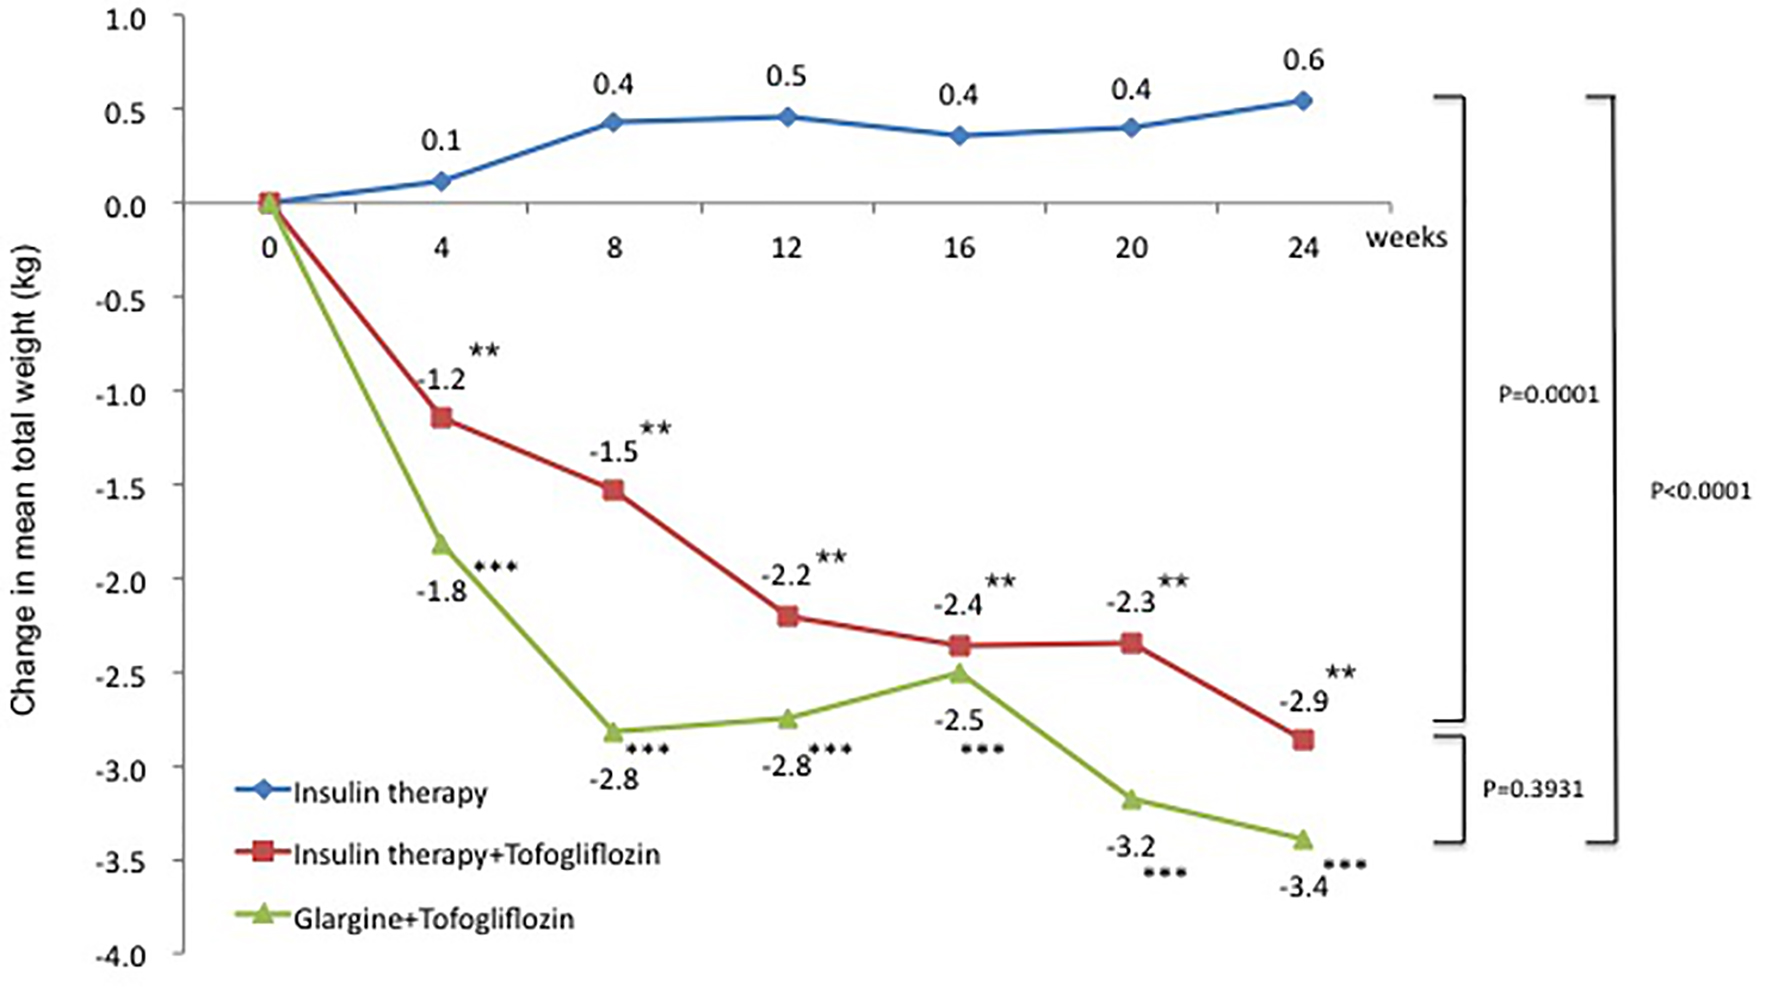
| Total weight, kg | |||
| Baseline (SD) | 69.8 (15.6) | 83.6 (20.5) | 79.2 (22.1) |
| Adjusted mean change from baseline (95% CI; P-value) | 0.6 (-0.28 to 1.39; 0.1772) | -2.9 (-4.46 to -1.27; 0.0014) | -3.4 (-4.87 to -1.91; 0.0002) |
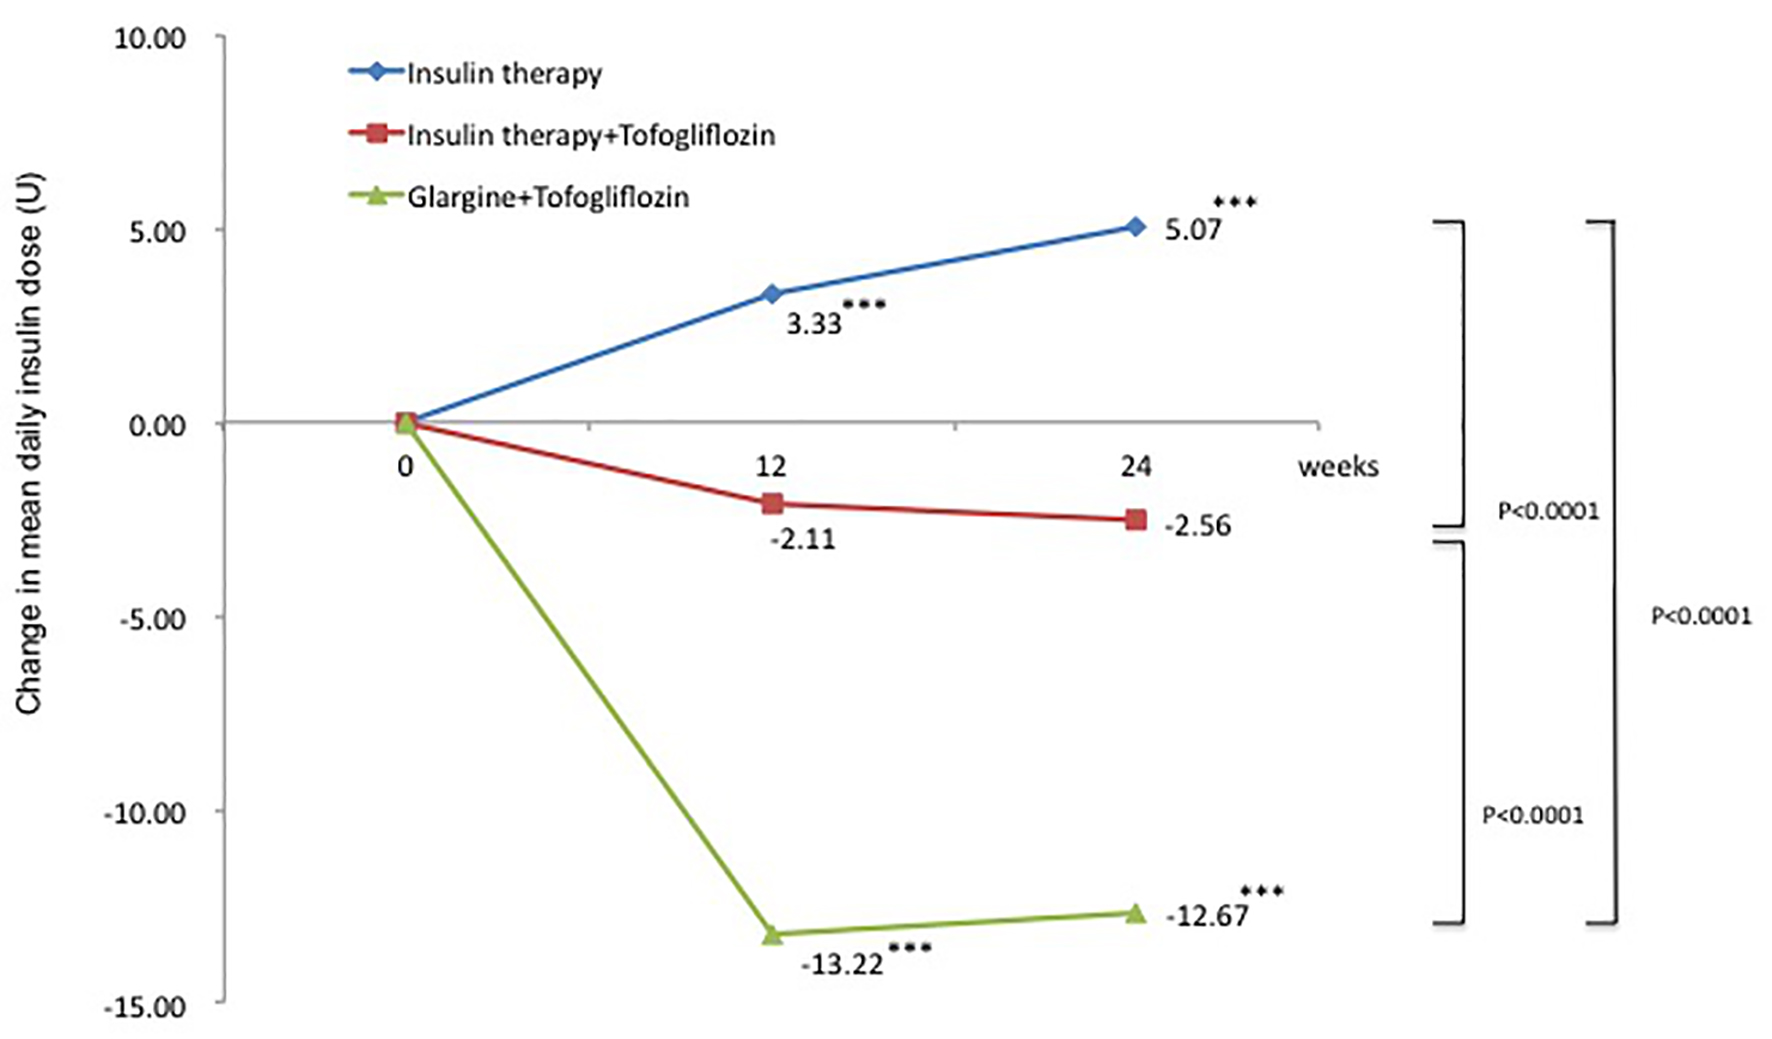
| Mean daily insulin dose, U | |||
| Baseline (SD) | 35.9 (16.0) | 42.2 (23.1) | 39.9 (12.1) |
| Adjusted mean change from baseline (95% CI; P-value) | 5.1 (3.10 to 7.02; < 0.0001) | -2.6 (-5.57 to 0.45; 0.091) | -12.7 (-15.2 to -10.2; < 0.0001) |
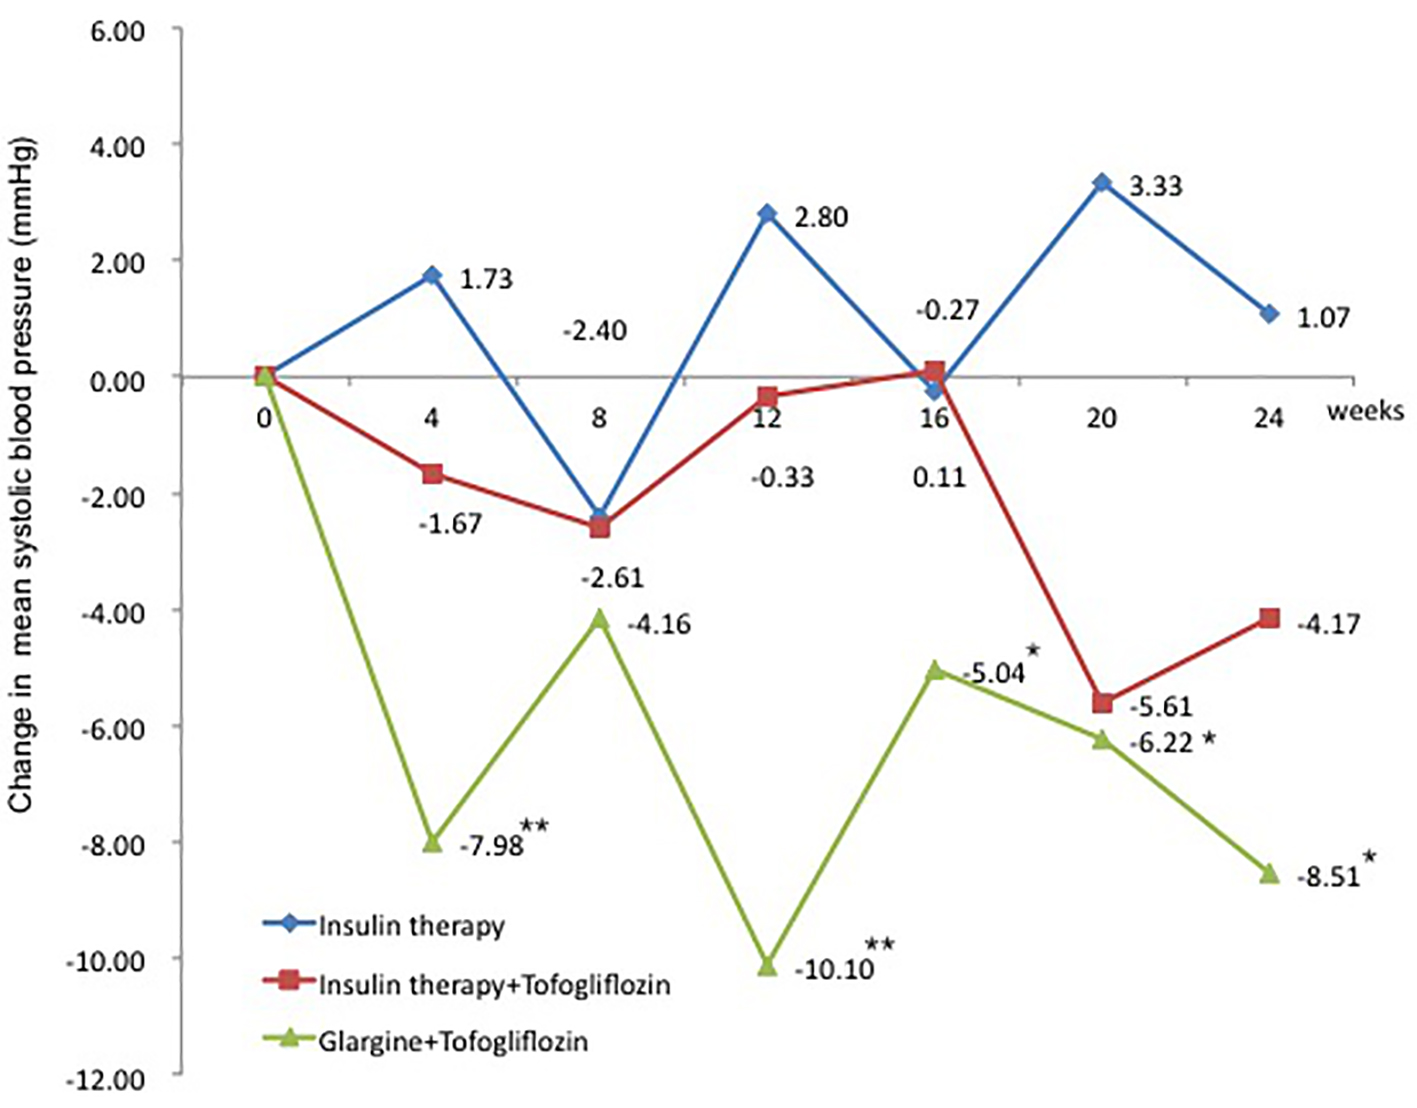
| Systolic blood pressure, mm Hg | |||
| Baseline (SD) | 126.4 (9.5) | 127.5 (13.7) | 130.5 (5.9) |
| Adjusted mean change from baseline (95% CI; P-value) | 1.1 (-5.83 to 7.97; 0.7341) | -4.2 (-10.66 to 2.33; 0.1937) | -7.8 (-15.27 to -0.26; 0.0435) |
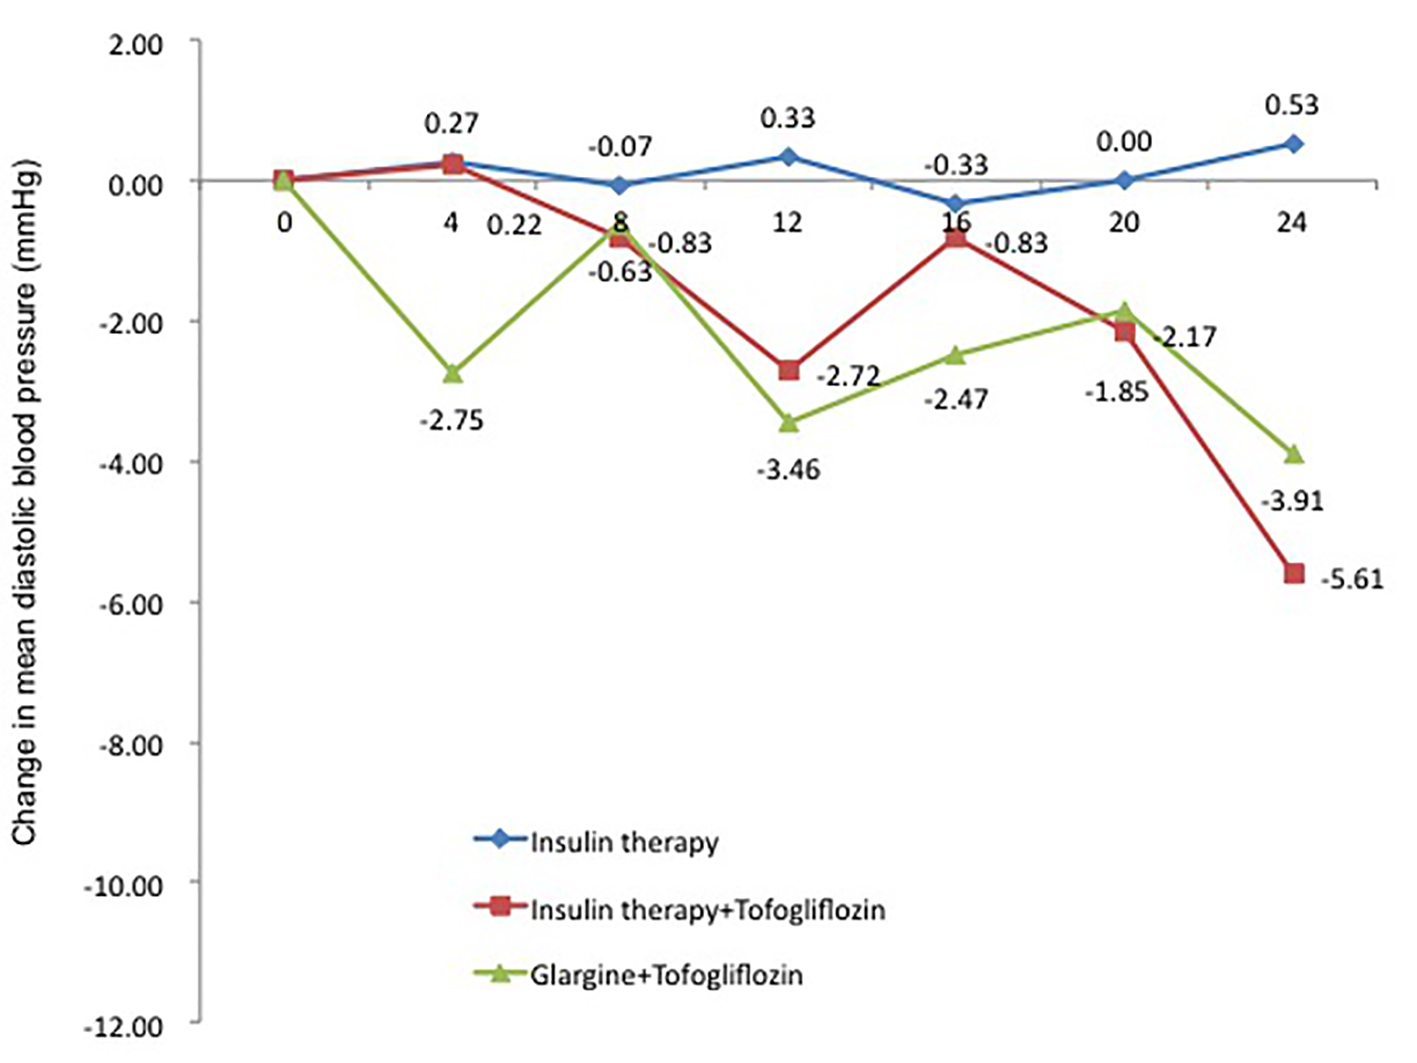
| Diastolic blood pressure, mm Hg | |||
| Baseline (SD) | 74.3 (12.9) | 76.4 (13.3) | 74.6 (10.3) |
| Adjusted mean change from baseline (95% CI; P-value) | 0.5 (-5.60 to 6.67; 0.8548) | -5.6 (-13.71 to 2.49; 0.1623) | -3.3 (-8.68 to 2.06; 0.2083) |
| HDL cholesterol, mg/dL | |||
| Baseline (SD) | 54.5 (12.5) | 54.0 (12.5) | 54.5 (10.1) |
| Adjusted mean change from baseline (95% CI; P-value) | 2.3 (-4.15 to 8.93; 0.4429) | 1.8 (-1.01 to 4.68; 0.1925) | -1.57 (3.61 to 0.46; 0.1191) |
| Triglycerides, mg/dL | |||
| Baseline (SD) | 147.8 (72.2) | 166.6 (114.4) | 152.9 (55.8) |
| Adjusted mean change from baseline (95% CI; P-value) | -0.85 (-22.40 to 20.71; 0.9333) | -13.1 (-59.31 to 33.09; 0.5572) | -25.6 (-44.39 to -6.89; 0.0112) |
| LDL cholesterol, mg/dL | |||
| Baseline (SD) | 102.2 (19.2) | 103.2 (17.3) | 108.6 (24.2) |
| Adjusted mean change from baseline (95% CI; P-value) | 2.0 (-5.00 to 9.00; 0.5455) | 2.2 (-4.28 to 8.73; 0.4807) | 2.2 (-4.28 to 8.72; 0.4807) |
| Total cholesterol, mg/dL | |||
| Baseline (SD) | 102.2 (19.2) | 103.2 (17.3) | 108.6 (24.2) |
| Adjusted mean change from baseline (95% CI; P-value) | 2.0 (-5.00 to 9.00; 0.5455) | 2.2 (-4.28 to 8.73; 0.4807) | 2.2 (-4.28 to 8.72; 0.4807) |
| eGFR, mL/min/1.73 m2 | |||
| Baseline (SD) | 85.3 (23.1) | 89.4 (34.6) | 91.7 (29.3) |
| Adjusted mean change from baseline (95% CI; P-value) | -10.9 (-20.73 to -1.00; 0.0332) | -8.8 (-14.28 to -3.28; 0.0037) | -3.2 (-11.56 to 5.14; 0.4282) |
| Insulin (n = 15) | Insulin + tofogliflozin (n = 19) | Glargine + tofogliflozin (n = 19) | |
|---|---|---|---|
| *Patient self-reporting only. Number of patients with hypoglycemia during the follow-up period. There were no significant differences among the groups. | |||
| Hypoglycemia (n) | 4 | 5 | 4 |