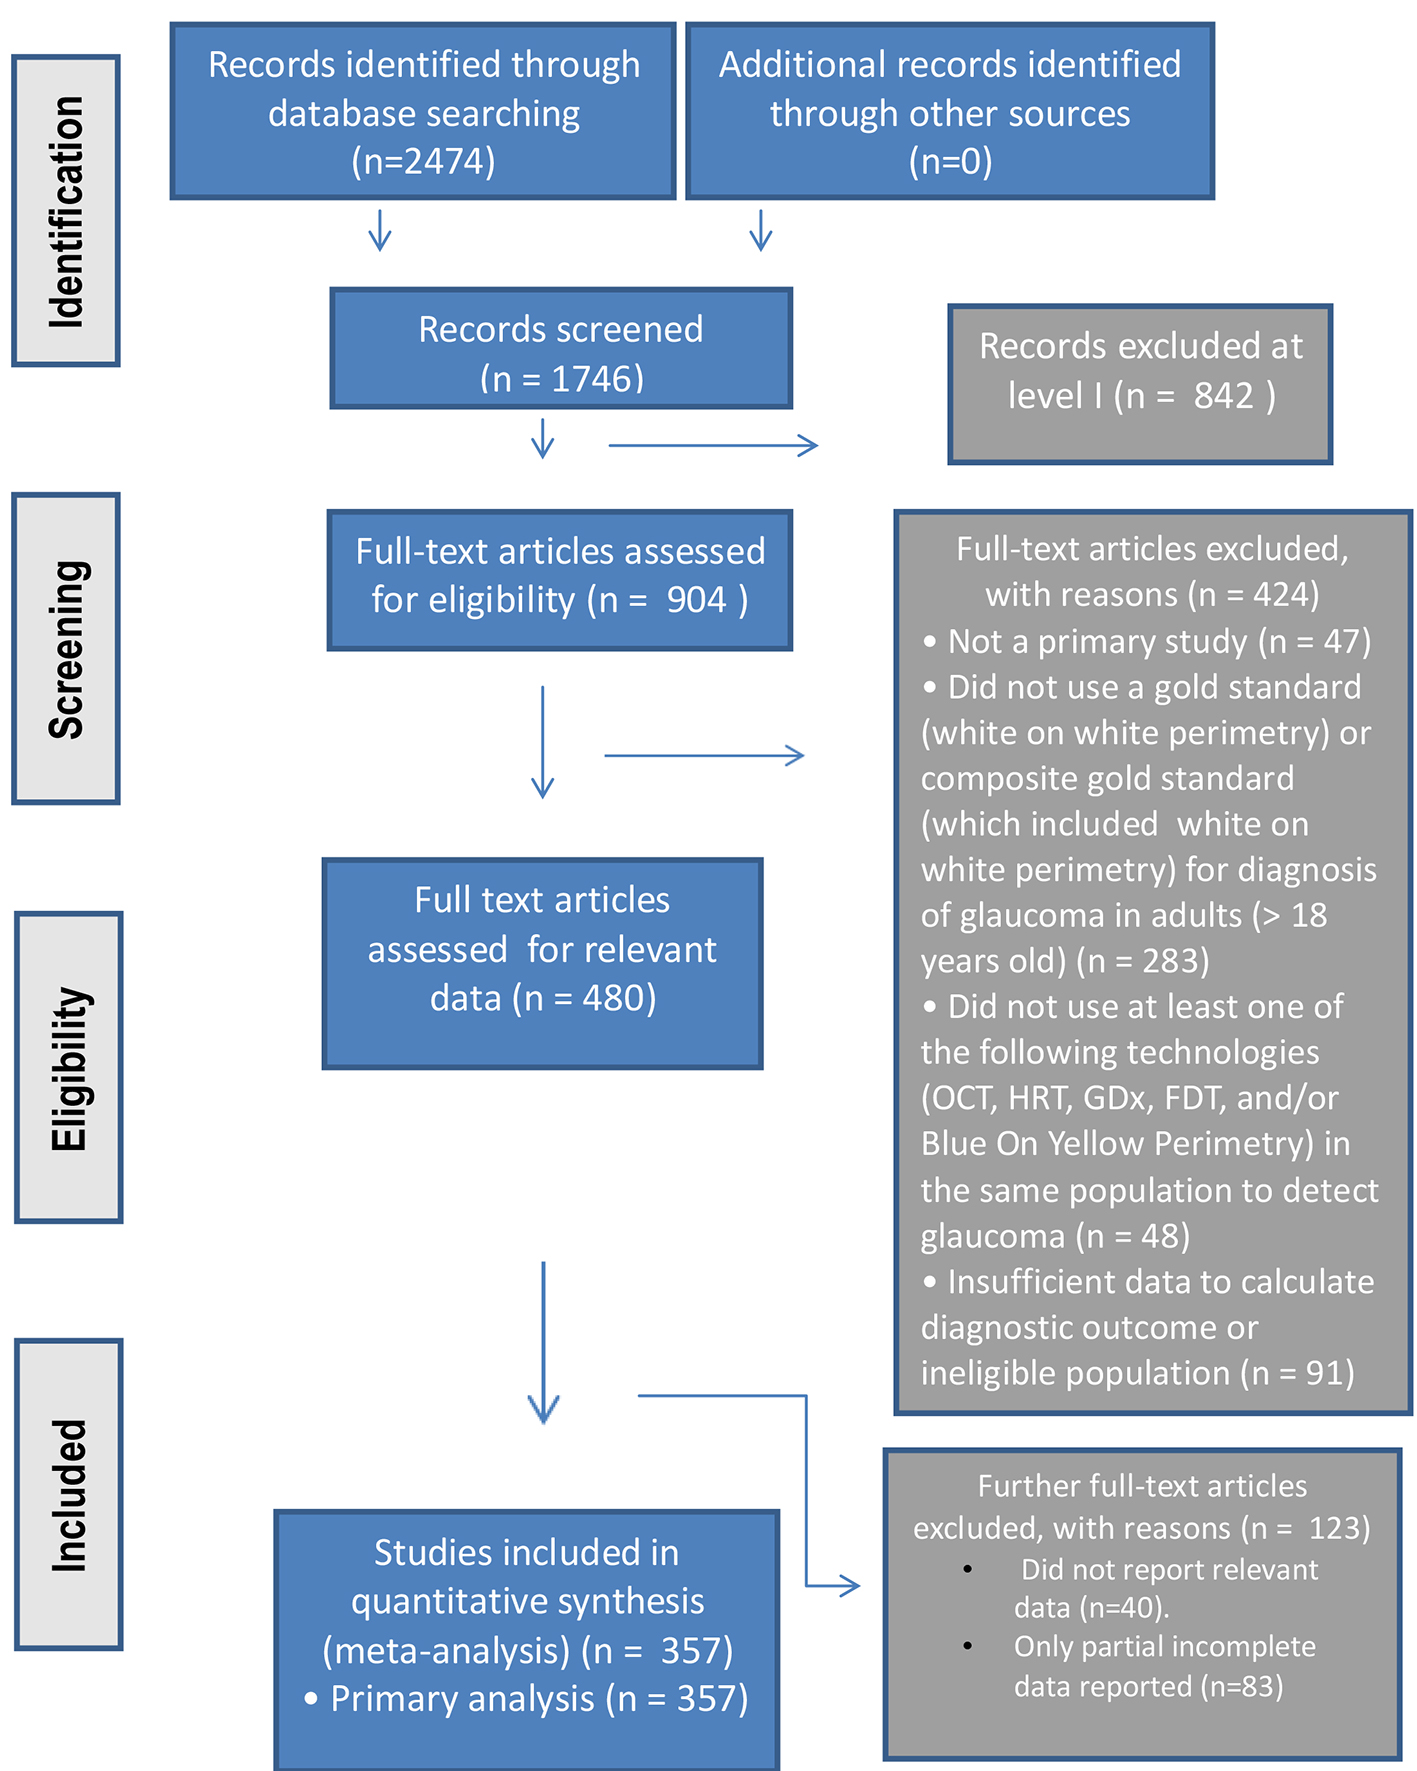
Figure 1. The PRISMA study process summarized in flowchart format.
| Journal of Clinical Medicine Research, ISSN 1918-3003 print, 1918-3011 online, Open Access |
| Article copyright, the authors; Journal compilation copyright, J Clin Med Res and Elmer Press Inc |
| Journal website http://www.jocmr.org |
Original Article
Volume 8, Number 9, September 2016, pages 641-649
Summary of Glaucoma Diagnostic Testing Accuracy: An Evidence-Based Meta-Analysis
Figure
Tables
| Items | % assessed as yes | % assessed as no | % assessed as unclear |
|---|---|---|---|
| 1. Was the spectrum of patients representative of the patients who will receive the test in practice? | 44 | 15 | 41 |
| 2. Were selection criteria clearly described? | 82 | 1 | 17 |
| 3. Is the reference standard likely to correctly classify the target condition? | 93 | 4 | 3 |
| 4. Is the time period between reference standard and index test short enough to be reasonably sure that the target condition did not change between the two tests? | 93 | 0 | 7 |
| 5. Did the whole sample or a random selection of the sample, receive verification using a reference standard of diagnosis? | 73 | 3 | 24 |
| 6. Did patients receive the same reference standard regardless of the index test result? | 99 | 0 | 1 |
| 7. Was the reference standard independent of the index test (i.e. the index test did 1t form part of the reference standard)? | 99 | 0 | 1 |
| 8. Was the execution of the index test described in sufficient detail to permit replication of the test? | 97 | 1 | 2 |
| 9. Was the execution of the reference standard described in sufficient detail to permit its replication? | 95 | 2 | 3 |
| 10. Were the index test results interpreted without knowledge of the results of the reference standard? | 82 | 3 | 15 |
| 11. Were the reference standard results interpreted without knowledge of the results of the index test? | 22 | 6 | 72 |
| 12. Were the same clinical data available when test results were interpreted as would be available when the test is used in practice? | 26 | 2 | 72 |
| 13. Were un-interpretable/ intermediate test results reported? | 69 | 9 | 22 |
| 14. Were withdrawals from the study explained? | 42 | 21 | 37 |
| # Studies | Pooled results | ||||
|---|---|---|---|---|---|
| Sensitivity | Specificity | Sensitivity | Specificity | Diagnostic odds ratio | |
| Primary analysis | |||||
| HRT | 132 | 132 | 78.8 (76.6 - 80.8) | 82.8 (80.6 - 84.7) | 17.8 (15.2 - 20.8) |
| GDx (FCC and VCC) | 103 | 103 | 84.5 (81.7 - 87.0) | 85.6 (82.9 - 87.9) | 32.4 (25.6 - 40.9) |
| OCT (all types) | 84 | 84 | 83.2 (80.7 - 85.4) | 89.4 (87.5 - 91.0) | 41.8 (33.5 - 52.0) |
| FDT | 57 | 57 | 84.7 (79.1 - 89.0) | 91.2 (88.2 - 93.5) | 57.7 (35.8 - 92.9) |
| Blue on yellow | 5 | 6 | 87.2 (67.2 - 95.8) | 83.2 (68.4 - 91.9) | 46.7 (7.58 - 288.2) |
| Secondary analysis | |||||
| HRT I and II | 102 | 102 | 77.8 (75.3 - 80.0) | 84.5 (82.2 - 86.6) | 19.1 (15.7 - 23.1) |
| HRT III | 30 | 30 | 81.9 (77.3 - 85.7) | 76.3 (71.7 - 80.4) | 14.6 (11.4 - 18.6) |
| GDx-VCC | 98 | 98 | 84.9 (82.1 - 87.3) | 85.7 (83.0 - 88.0) | 33.7 (26.4 - 42.9) |
| GDx-FCC | 5 | 5 | 76.6 (60.0 - 87.7) | 84.2 (61.5 - 94.7) | 17.5 (8.9 - 34.1) |
| OCT time domain stratus | 67 | 67 | 83.2 (80.4 - 85.6) | 88.7 (86.5 - 90.6) | 38.7 (30.2 - 49.7) |
| OCT spectral domain cirrus | 17 | 17 | 83.3 (77.2 - 88.0) | 91.6 (87.8 - 94.2) | 54.1 (34.9 - 83.9) |
| OCT-spectralis | 1 | 1 | Only one study - no pooled results | ||
| FDT | 57 | 57 | 84.7 (79.1 - 89.0) | 91.2 (88.2 - 93.5) | 57.7 (35.8 - 92.9) |
| Blue on yellow | 5 | 6 | 87.2 (67.2 - 95.8) | 83.2 (68.4 - 91.9) | 46.7 (7.58 - 288.2) |
| DORs | Overall | Overall less outliers | Peer review | Industry | Age > 55 | Age < 55 | Cauc > 50% | Cauc < 50% | Fem > 50% | Fem < 50% | AUC |
|---|---|---|---|---|---|---|---|---|---|---|---|
| HRT | 17.82 | 18.18 | 16.94 | 18.56 | 17.56 | 19.99 | 19 | 13.99 | 17.64 | 18.62 | 0.839 |
| GDx | 32.38 | 29.53 | 35.61 | 30.12 | 31.67 | 41.41 | 33.2 | 24.65 | 33.49 | 31.23 | 0.881 |
| OCT | 41.76 | 43.36 | 39.29 | 43.62 | 41.26 | 47.11 | 43.2 | 38.92 | 49.14 | 25.94 | 0.901 |
| FDT | 57.7 | 60.96 | 57.29 | 58.03 | 56.01 | 61.18 | 57.53 | 67.71 | 57.53 | 45.44 | 0.893 |
| BY | 46.7 | NA | NA | NA | NA | NA | NA | NA | NA | NA | 0.888 |
| HRT I-II | 19.05 | 19.87 | 16.41 | 22.96 | 19.11 | 17.81 | 18.45 | 16.35 | 18.45 | 22.25 | 0.843 |
| HRT III | 14.56 | 15.17 | 24.5 | 13.1 | 13.82 | NA | 16.89 | 10.72 | 15.31 | 13.07 | 0.829 |
| GDx VCC | 33.65 | 31.27 | 35.61 | 32.06 | 32.97 | 41.41 | 34.54 | 24.5 | 35.09 | 31.61 | 0.882 |
| GDx FCC | 17.46 | 17.46 | NA | 17.46 | 17.46 | NA | 15.03 | NA | 15.03 | NA | 0.859 |
| OCT-T | 38.73 | 38 | 34.15 | 42.92 | 38.66 | 50.13 | 41.28 | 31.63 | 45.34 | 23.91 | 0.898 |
| OCT-C | 54.12 | 54.12 | 95.27 | 46 | 54.2 | 56.79 | 62.28 | 47.8 | 66.99 | 31.98 | 0.907 |
| OCT-S | NA | NA | NA | NA | NA | NA | NA | NA | NA | NA | 0.88 |
| Technology | Sensitivity I2 | Specificity I2 | Diagnostic odds ratio I2 |
|---|---|---|---|
| Primary outcome | |||
| HRT | 68.7 | 86.3 | 71.4 |
| GDx | 86.2 | 85.3 | 72.5 |
| OCT | 75.3 | 73.7 | 69.5 |
| FDT | 97.5 | 94.7 | 94.3 |
| Blue on yellow | 79.8 | 79.1 | 84.4 |
| Secondary outcomes | |||
| HRT I and II | 78.7 | 87.3 | 81.4 |
| HRT III | 60.9 | 85.3 | 62.1 |
| Scanning laser VCC | 86.6 | 85.2 | 74.5 |
| Scanning laser FCC | 85.5 | 83.3 | 84.0 |
| Time domain OCT | 76.7 | 75.6 | 70.5 |
| Spectral domain OCT | 73.0 | 63.7 | 65.9 |
| FDT | 97.5 | 94.7 | 94.3 |
| Blue on yellow | 79.8 | 79.1 | 84.4 |
| Technology | Number of methods/cutoffs encountered |
|---|---|
| OCT | 52 |
| GDx | 66 |
| Blue on yellow | 4 |
| FDT | 52 |
| HRT I and II | 43 |
| HRT III | 6 |