
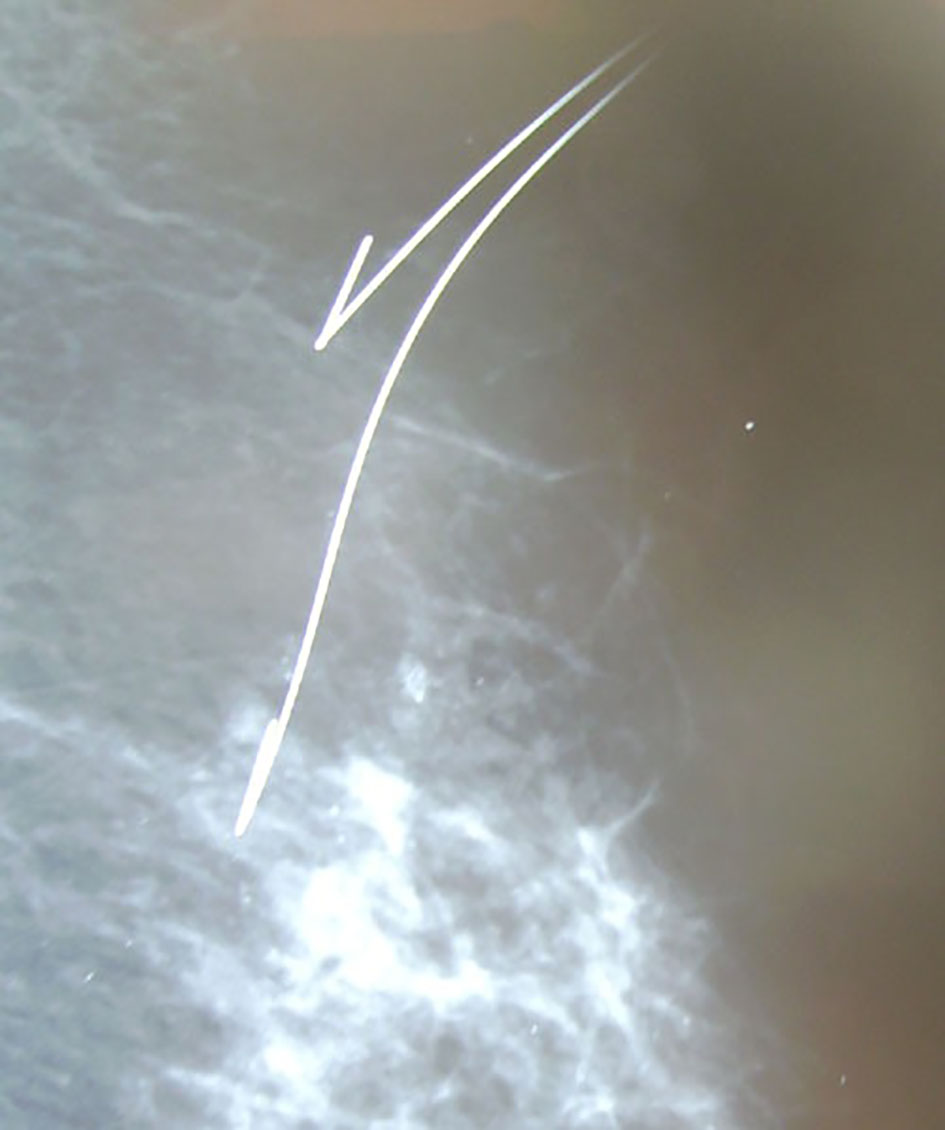
Figure 1. Mammographic appearance of spiculated breast lesion with microcalcifications.
| Journal of Clinical Medicine Research, ISSN 1918-3003 print, 1918-3011 online, Open Access |
| Article copyright, the authors; Journal compilation copyright, J Clin Med Res and Elmer Press Inc |
| Journal website http://www.jocmr.org |
Original Article
Volume 8, Number 5, May 2016, pages 389-395
Diagnostic Value of Hook Wire Localization Technique for Non-Palpable Breast Lesions
Figures
Tables
| Frozen | Permanent | |||||
|---|---|---|---|---|---|---|
| Benign | Suspicious | Malignant | Benign | Malignant | % | |
| Lymph node | 1 | 1 | 1.2 | |||
| Cyst | 1 | 1.2 | ||||
| Intraductal papilloma | 1 | 4 | 10 | 12 | ||
| Mastitis | 1 | 3 | 3.6 | |||
| Stromal fibrosis | 2 | 4 | 4.8 | |||
| Lypogranulomatous infection | 3 | 4 | 4.8 | |||
| Adipose tissue | 1 | 1 | 1.2 | |||
| Ductal epithelial hyperplasia | 11 | 6 | 21 | 25.3 | ||
| Microcalcification | 2 | 1 | 3 | 3.6 | ||
| Ductal ectasia | 4 | 1 | 8 | 9.6 | ||
| Fibroadenoma | 9 | 15 | 18 | |||
| Apocrine metaplasia | 8 | 1 | 11 | 13.2 | ||
| Fibrocystic disease | 4 | 2 | 8 | 9.6 | ||
| Adenosis | 5 | 4 | 13 | 15.6 | ||
| Tubular carcinoma | 1 | 1 | 1.2 | |||
| Ductal carsinoma in situ | 1 | 1 | 5 | 6 | ||
| Invasive ductal carcinoma | 1 | 4 | 8 | 9.6 | ||
| Mix carcinoma (invasive + lobuler) | 1 | 1 | 1.2 | |||
| Total | 52 | 22 | 6 | 103 | 15 | |
| Age | Malignant | Benign | Total | P | OR (95% CI) | |||
|---|---|---|---|---|---|---|---|---|
| OR: odds ratio; CI: confidence interval. | ||||||||
| < 35 | 0 | 0% | 10 | 100% | 10 | 100% | 0.159 | 0.17 (0.00 - 3.24) |
| 35 - 45 | 4 | 17.40% | 19 | 82.60% | 23 | 100% | 0.998 | 0.93 (0.25 - 3.31) |
| 45 - 55 | 5 | 14.70% | 29 | 85.30% | 34 | 100% | 0.573 | 0.67 (0.27 - 2.81) |
| 55 - 65 | 6 | 46.20% | 7 | 53.80% | 13 | 100% | 0.01 | 5.81 (1.59 - 21.2) |
| 65 - 75 | 0 | 0% | 2 | 100% | 2 | 100% | 0.999 | 0.85 (0.03 - 18.8) |
| > 75 | 0 | 0% | 1 | 100% | 1 | 100% | 0.999 | 1.45 (0.05 - 37.3) |
| BI-RADS | Malignant | Benign | Total | P | OR (95% CI) | |||
|---|---|---|---|---|---|---|---|---|
| OR: odds ratio; CI: confidence interval; BI-RADS: Breast Imaging-Reporting and Data System. | ||||||||
| 0 | 1 | 16.60% | 5 | 83.40% | 6 | 100% | 0.999 | 0.9 (0.09 - 8.3) |
| 3 | 0 | 0% | 27 | 100% | 27 | 100% | 0.001 | 0.04 (0.00 - 0.84) |
| 4 | 14 | 28.60% | 35 | 71.40% | 49 | 100% | 0.002 | 13.2 (1.6 - 10.3) |
| 5 | 0 | 0% | 1 | 100% | 1 | 100% | 0.999 | 1.45 (0.05 - 9.38) |
| Total | 15 | 68 | 83 | |||||
| BI-RADS | Malignant | Benign | Total | P | OR (95% CI) | |||
|---|---|---|---|---|---|---|---|---|
| OR: odds ratio; CI: confidence interval; BI-RADS: Breast Imaging-Reporting and Data System. | ||||||||
| 0 | 1 | 16.70% | 5 | 83.30% | 6 | 100% | 0.999 | 0.9 (0.09 - 8.3) |
| 3 | 0 | 0% | 27 | 100% | 27 | 100% | 0.001 | 0.04 (0.00 - 0.84) |
| 4a | 0 | 0% | 10 | 100% | 10 | 100% | 0.195 | 0.17 (0.0 - 3.24) |
| 4b | 6 | 37.50% | 10 | 62.50% | 16 | 100% | 0.035 | 3.86 (1.12 - 13.2) |
| 4c | 8 | 34.80% | 15 | 65.20% | 23 | 100% | 0.023 | 4.83 (1.25 - 12.9) |
| 5 | 0 | 0% | 1 | 100% | 1 | 100% | 0.999 | 1.45 (0.05 - 9.38) |
| Total | 15 | 68 | 83 | |||||
| Permanent | Sensitivity | Specificity | PPV | NPV | Accuracy | LR(+) | LR(-) |
|---|---|---|---|---|---|---|---|
| MMG: mammography; USG: ultrasonography; PPV: positive predictive value; NPV: negative predictive value; LR: likelihood ratio. | |||||||
| MMG | 0.93 | 0.55 | 0.41 | 0.96 | 0.64 | 2.05 | 0.13 |
| USG | 1.00 | 0.73 | 0.13 | 1.00 | 0.74 | 3.71 | 0.00 |
| Frozen | 0.60 | 0.97 | 0.86 | 0.90 | 0.89 | 21.60 | 0.41 |