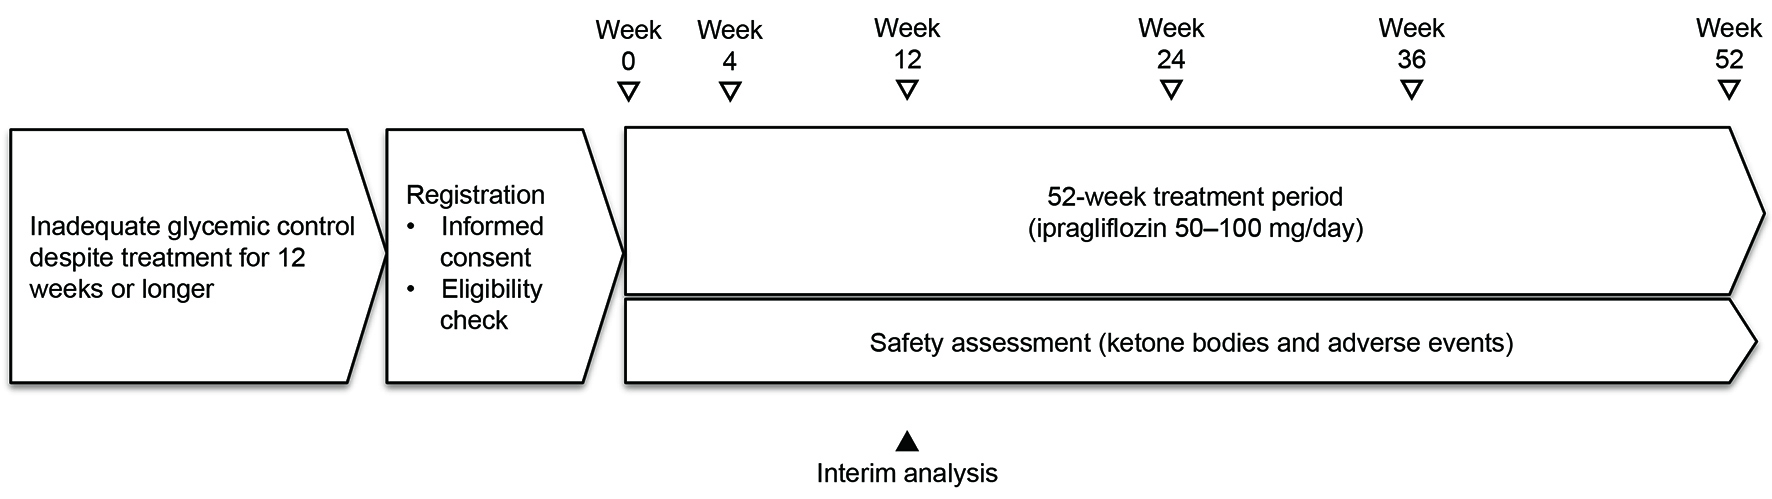
Figure 1. Outline of the study.
| Journal of Clinical Medicine Research, ISSN 1918-3003 print, 1918-3011 online, Open Access |
| Article copyright, the authors; Journal compilation copyright, J Clin Med Res and Elmer Press Inc |
| Journal website http://www.jocmr.org |
Original Article
Volume 8, Number 5, May 2016, pages 373-378
Factors Influencing Changes in Hemoglobin A1c and Body Weight During Treatment of Type 2 Diabetes With Ipragliflozin: Interim Analysis of the ASSIGN-K Study
Figure
Tables
| Characteristics | |
|---|---|
| SD: standard deviation; BMI: body mass index; HbA1c: hemoglobin A1c; NGSP: National Glycohemoglobin Standardization Program; eGFR: estimated glomerular filtration rate. | |
| Number | 257 |
| Age, mean ± SD | 53.9 ± 10.4 |
| < 65 years, n (%) | 215 (83.7) |
| ≥ 65 years, n (%) | 42 (16.3) |
| Sex | |
| Male, n (%) | 123 (47.9) |
| Female, n (%) | 134 (52.1) |
| Weight, kg, mean ± SD | 80.3 ± 17.4 |
| BMI, kg/m2, mean ± SD | 30.0 ± 5.4 |
| HbA1c, % (NGSP), mean ± SD (n) | 8.2 ± 1.5 (254) |
| Fasting glucose, mg/dL, mean ± SD (n) | 158.5 ± 43.6 (110) |
| Postprandial glucose, mg/dL, mean ± SD (n) | 199.1 ± 85.2 (93) |
| Duration of diabetes, years, mean ± SD (n) | 9.6 ± 6.9 (248) |
| Systolic blood pressure, mm Hg, mean ± SD (n) | 131.3 ± 15.9 (254) |
| Diastolic blood pressure, mm Hg, mean ± SD (n) | 78.3 ± 10.6 (254) |
| eGFR, mL/min/1.73 m2, mean ± SD | 83.89 ± 21.67 |
| < 60 mL/min/1.73 m2, n (%) | 31 (12.3) |
| ≥ 60 mL/min/1.73 m2, n (%) | 222 (87.7) |
| Drinking alcohol | |
| Yes, number (%) | 87 (33.9) |
| No, number (%) | 169 (65.8) |
| Smoking tobacco | |
| Yes, number (%) | 78 (30.4) |
| No, number (%) | 178 (69.3) |
| n | Baseline | Week 4 | Week 12 | |
|---|---|---|---|---|
| Analysis of variance: vs. baseline *P < 0.01, week 4 vs. week 12 †P < 0.01. HbA1c: hemoglobin A1c; BMI: body mass index. | ||||
| HbA1c, % | 257 | 8.23 | 7.81* | 7.55*† |
| Fasting glucose, mg/dL | 110 | 158.5 | 139.2* | 134.6* |
| Postprandial glucose, mg/dL | 93 | 199.1 | 161.0* | 154.9* |
| Body weight, kg | 240 | 79.9 | 78.8* | 78.1*† |
| BMI, kg/m2 | 241 | 29.9 | 29.5* | 29.2*† |
| Waist circumference, cm | 250 | 101.2 | 99.9* | 99.0*† |
| Independent variable | Standardized coefficient β | Partial regression coefficient | P value |
|---|---|---|---|
| n = 243. Stepwise analysis with the following independent variables: age, sex, duration of diabetes, baseline HbA1c, baseline BMI, and treatment category (new monotherapy, concurrent administration, or switching treatment). Dependent variable: decrease in HbA1c. BMI: body mass index; HbA1c: hemoglobin A1c. | |||
| Constant | 0 | 2.050 | 0.0034 |
| Age | 0.020 | 0.002 | 0.7324 |
| Sex | 0.081 | 0.203 | 0.1196 |
| Duration of diabetes | 0.205 | 0.037 | 0.0003 |
| BMI (baseline) | 0.080 | 0.019 | 0.1213 |
| HbA1c (baseline) | -0.585 | -0.485 | < 0.0001 |
| Switching treatment | 0.206 | 0.806 | < 0.0001 |
| Independent variable | Standardized coefficient β | Partial regression coefficient | P value |
|---|---|---|---|
| n = 238. Stepwise analysis with the following independent variables: age, sex, duration of diabetes, baseline HbA1c, and baseline BMI. Dependent variable: decrease in body weight. BMI: body mass index; HbA1c: hemoglobin A1c. | |||
| Constant | 0 | -0.117 | 0.9422 |
| Age | -0.065 | -0.015 | 0.3714 |
| Sex | -0.092 | -0.436 | 0.1447 |
| Duration of diabetes | 0.051 | 0.018 | 0.4502 |
| BMI (baseline) | -0.237 | -0.111 | 0.0002 |
| HbA1c (baseline) | 0.215 | 0.334 | 0.0005 |