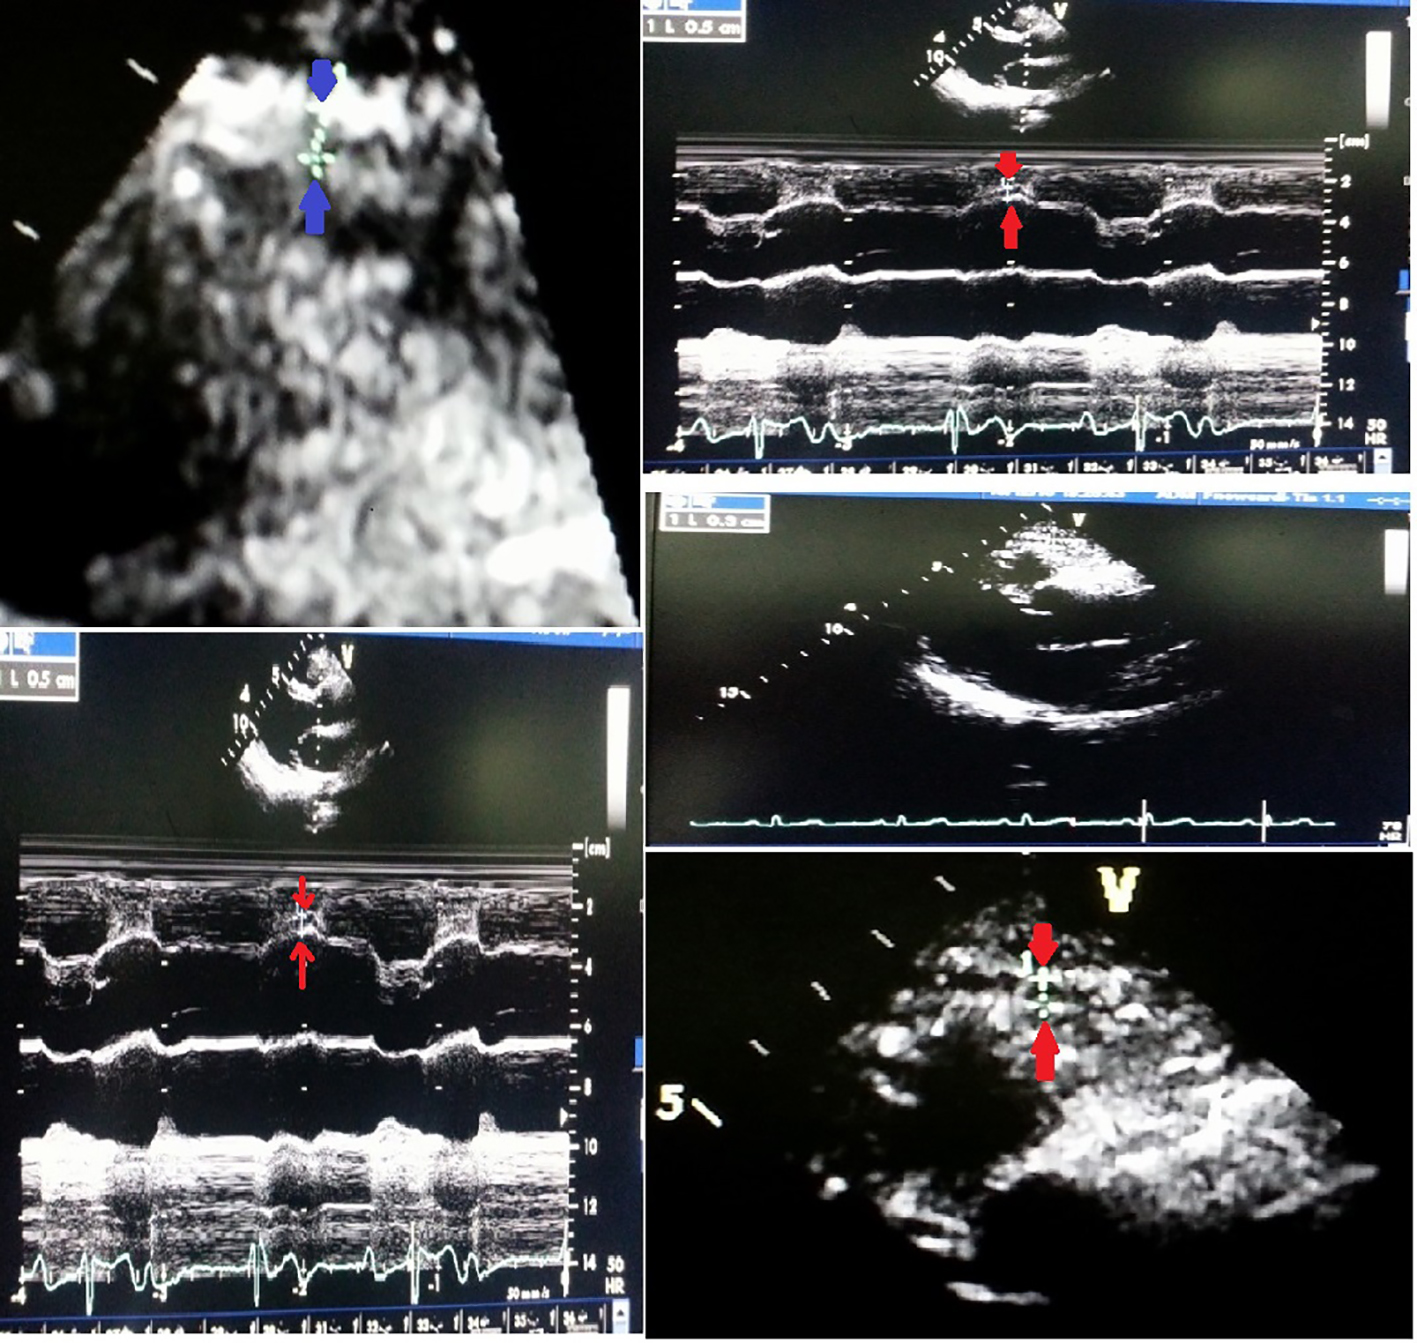
Figure 1. EAT thickness is identified as the echo-free space between the outer wall of the myocardium and the visceral layer of pericardium in the PLAX view.
| Journal of Clinical Medicine Research, ISSN 1918-3003 print, 1918-3011 online, Open Access |
| Article copyright, the authors; Journal compilation copyright, J Clin Med Res and Elmer Press Inc |
| Journal website http://www.jocmr.org |
Original Article
Volume 8, Number 5, May 2016, pages 410-419
Epicardial Adipose Tissue Thickness and Its Association With the Presence and Severity of Coronary Artery Disease in Clinical Setting: A Cross-Sectional Observational Study
Figures
Tables
| Age group | Male (n = 405) | % | Female (n = 144) | % | Total |
|---|---|---|---|---|---|
| 20 - 30 years | 24 | 6 | 5 | 3 | 29 |
| 30 - 40 years | 56 | 14 | 33 | 23 | 89 |
| 40 - 50 years | 118 | 29 | 29 | 20 | 147 |
| 50 - 60 years | 136 | 33 | 46 | 32 | 182 |
| > 60 years | 71 | 18 | 31 | 22 | 102 |
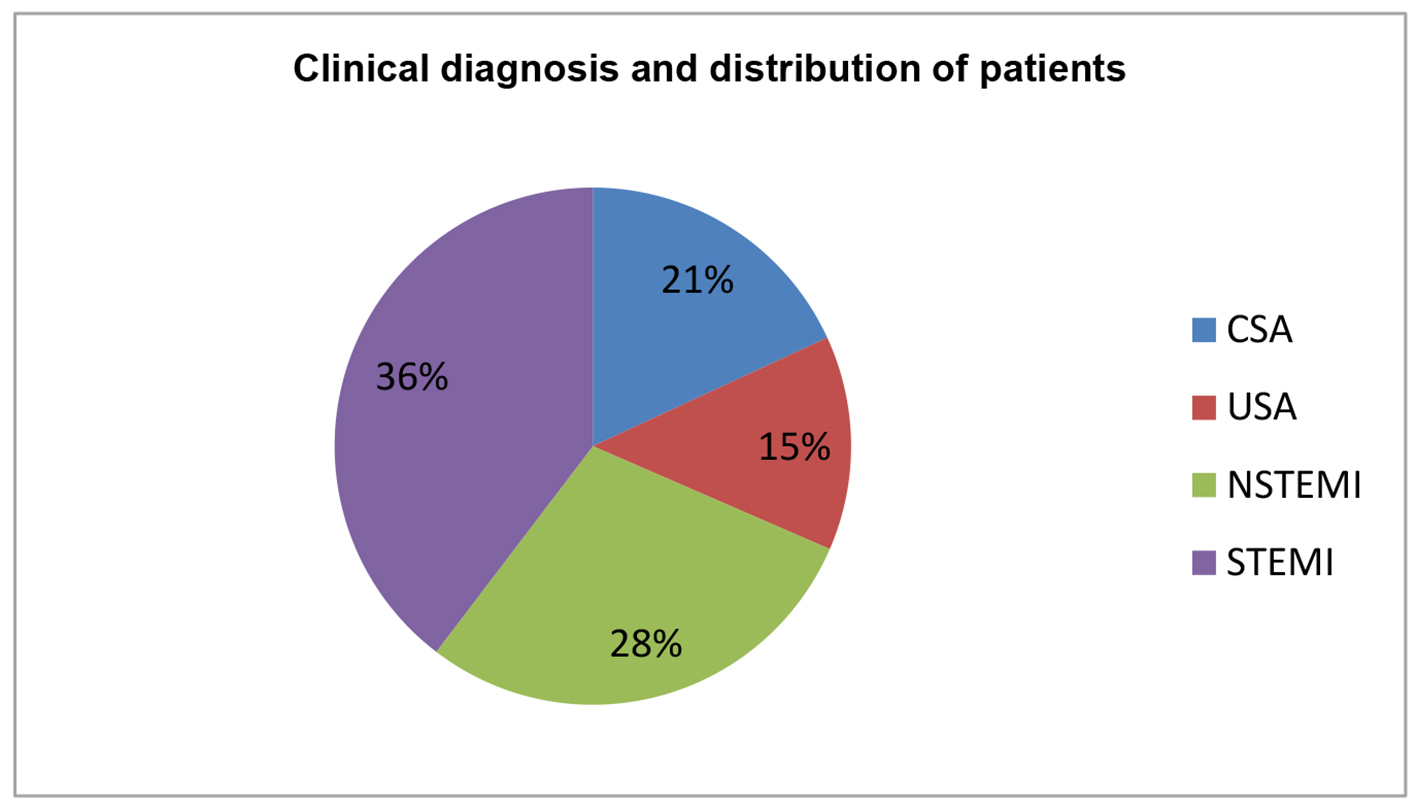
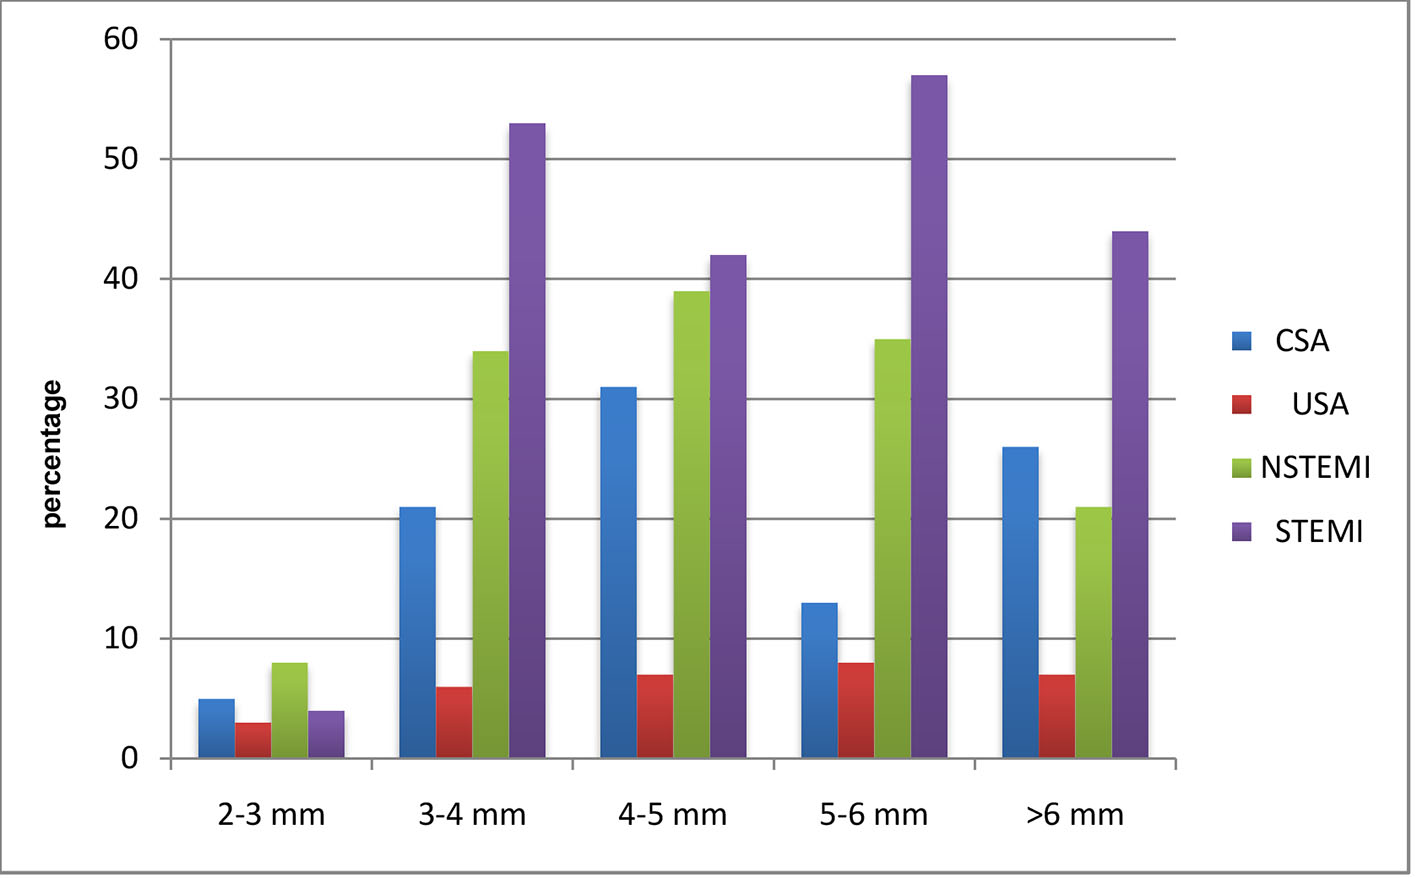
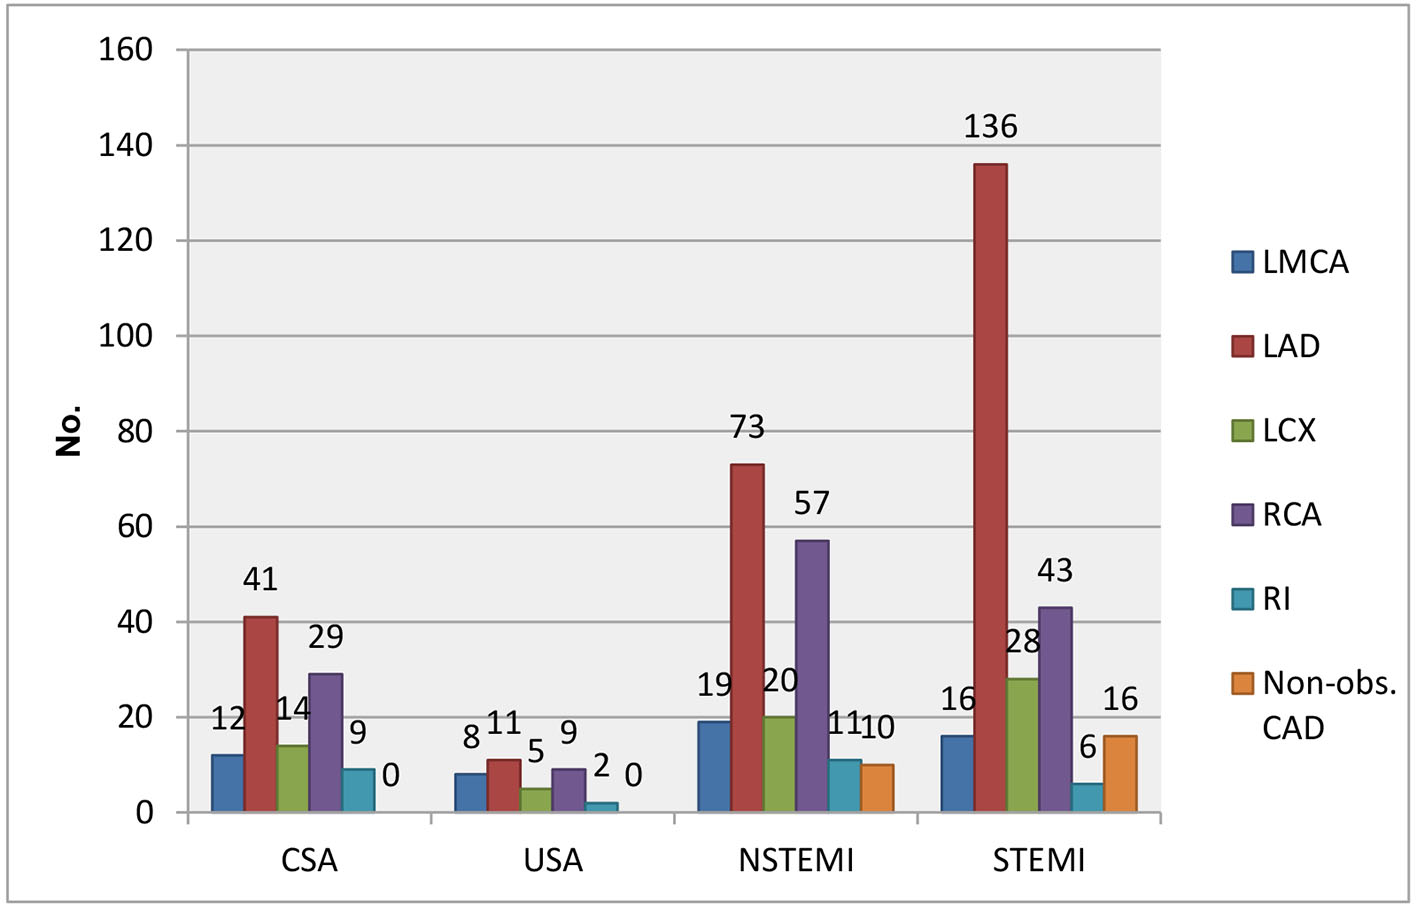
| Diagnosis | No. (n) | Male (n) | Female (n) | % |
|---|---|---|---|---|
| CSA | 115 | 95 | 20 | 21 |
| USA | 81 | 44 | 37 | 15 |
| NSTEMI | 153 | 95 | 58 | 28 |
| STEMI | 200 | 171 | 29 | 36 |
| Total | 549 | 405 | 144 | 100 |
| Diagnosis | CAD (n = 464) | Non-CAD (n = 85) | RR (95% CI) | P-value | ||
|---|---|---|---|---|---|---|
| No. | % | No. | % | |||
| RR: relative risk; CI: confidence interval. | ||||||
| CSA | 96 | 20 | 19 | 22 | 0.92 (0.71 - 1.18) | 0.51 |
| USA | 31 | 7 | 50 | 59 | 0.89 (0.55 - 0.43) | 0.59 |
| NSTEMI | 137 | 29 | 16 | 19 | 0.97 (0.73 - 0.30) | 0.87 |
| STEMI | 200 | 44 | 0 | 0 | 1.15 (0.91 - 0.44) | 0.25 |
| Total | 464 | 100 | 85 | 100 | ||
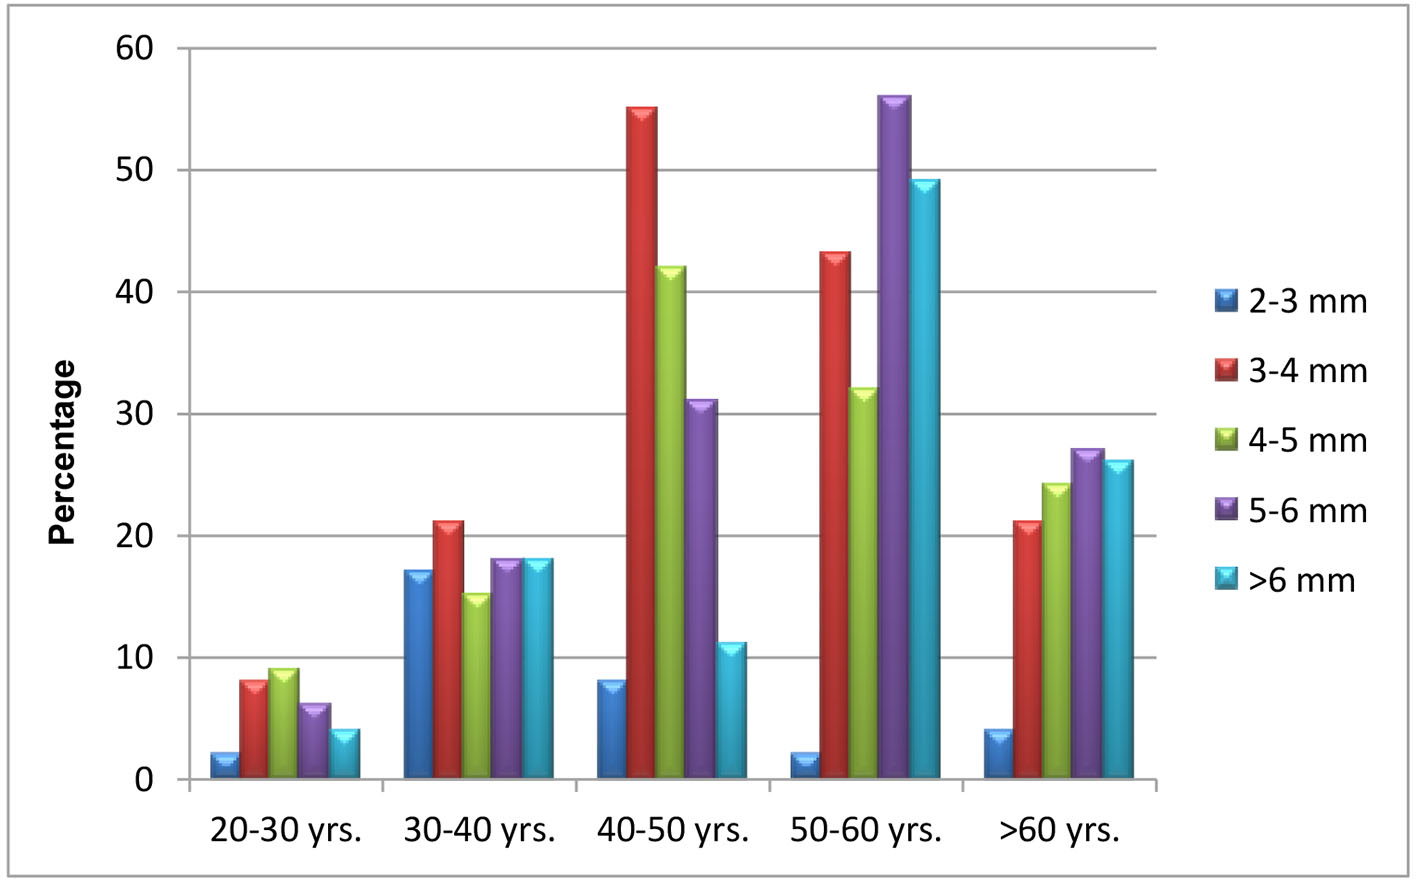
| Age group | EAT 2 mm | EAT 3 - 4 mm | EAT 4 - 5 mm | EAT 5 - 6 mm | EAT > 6 mm |
|---|---|---|---|---|---|
| 20 - 30 years | 2 | 8 | 9 | 6 | 4 |
| 30 - 40 years | 17 | 21 | 15 | 18 | 18 |
| 40 - 50 years | 8 | 55 | 42 | 31 | 11 |
| 50 - 60 years | 2 | 43 | 32 | 56 | 49 |
| > 60 years | 4 | 21 | 24 | 27 | 26 |
| Total | 33 | 148 | 122 | 138 | 108 |
| Category | Epicardial fat thickness |
|---|---|
| CAD | 5.16 ± 1.06 |
| Non-CAD | 4.23 ± 1.01 |
| Unpaired t-test (P-value) | 0.003* |
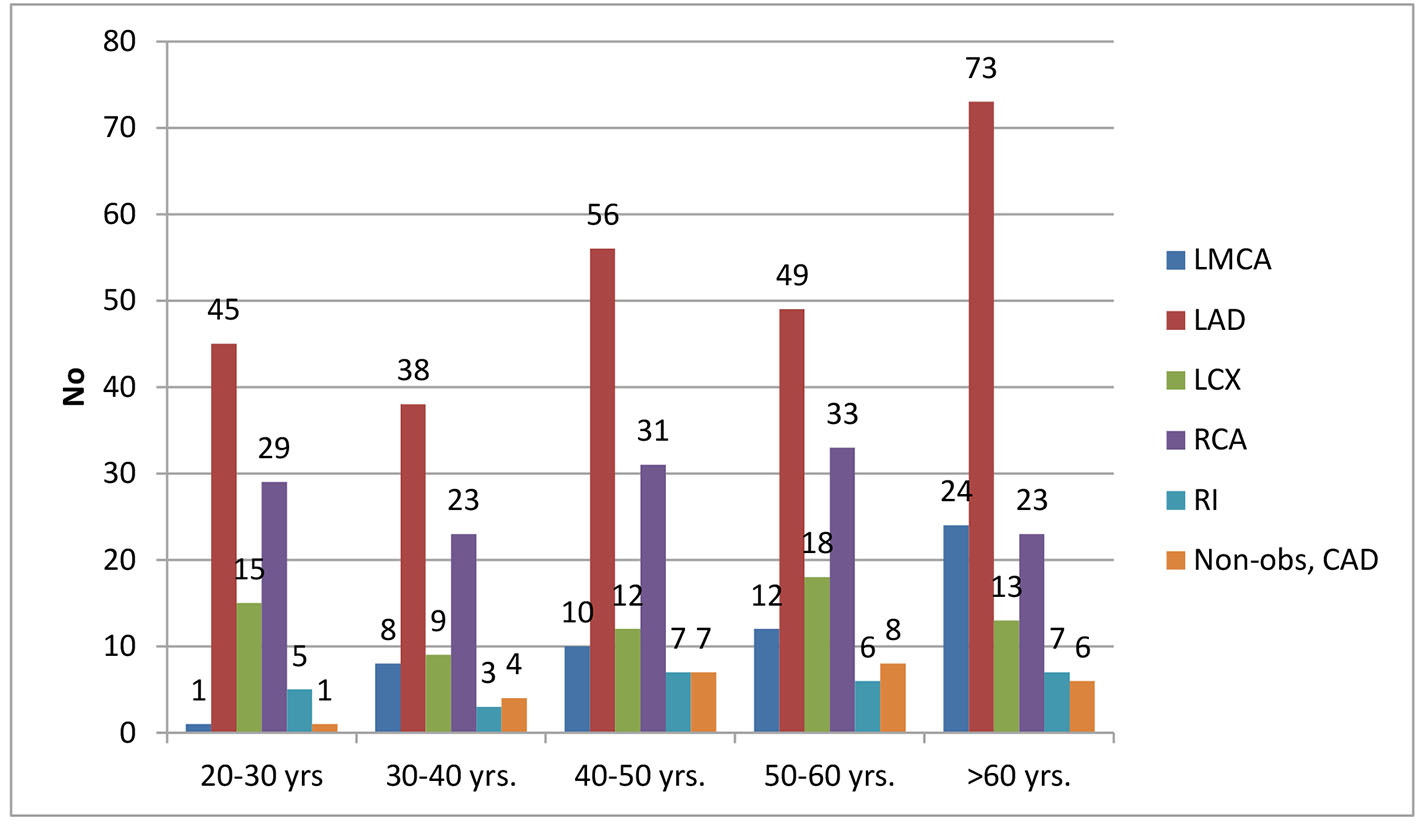
| Age group | LMCA (> 50%) | LAD (> 70%) | LCX (> 70%) | RCA (> 70%) | RI (> 70%) | Non-obstructive CAD |
|---|---|---|---|---|---|---|
| 20 - 30 years | 1 | 45 | 15 | 29 | 5 | 1 |
| 30 - 40 years | 8 | 38 | 9 | 22 | 3 | 4 |
| 40 - 50 years | 10 | 56 | 12 | 31 | 7 | 7 |
| 50 - 60 years | 12 | 49 | 18 | 33 | 6 | 8 |
| > 60 years | 24 | 73 | 13 | 23 | 7 | 6 |
| Total | 55 | 261 | 67 | 138 | 28 | 26 |
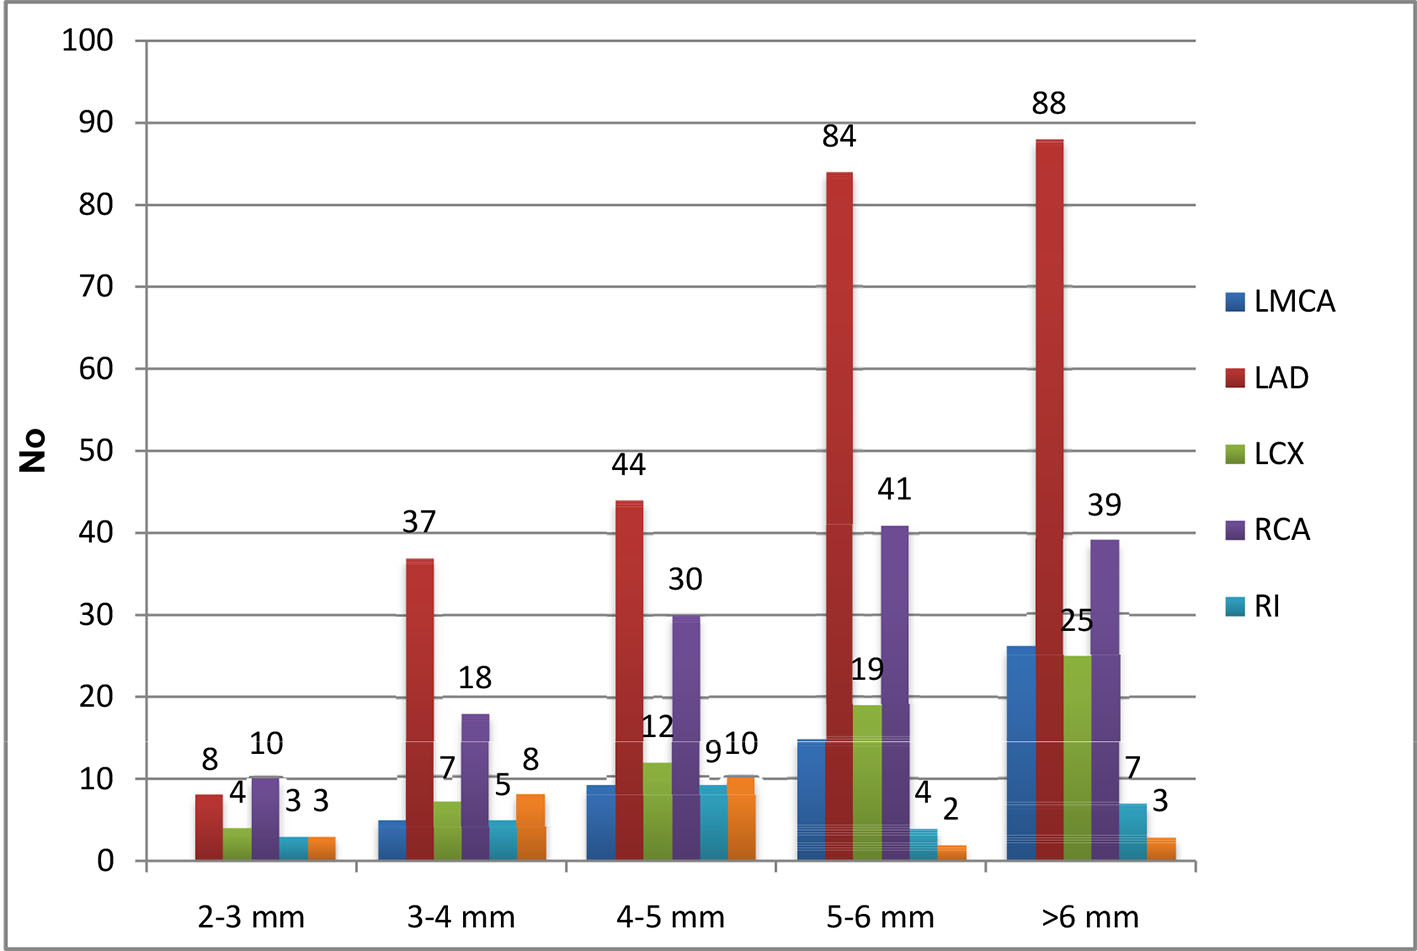
| EAT | LMCA | LAD | LCX | RCA | RI | Non-obstructive CAD |
|---|---|---|---|---|---|---|
| 2 - 3 mm | 0 | 8 | 4 | 10 | 3 | 3 |
| 3 - 4 mm | 5 | 37 | 7 | 18 | 5 | 8 |
| 4 - 5 mm | 9 | 44 | 12 | 30 | 9 | 10 |
| 5 - 6 mm | 15 | 84 | 19 | 41 | 4 | 2 |
| > 6 mm | 26 | 88 | 25 | 39 | 7 | 3 |
| Total | 55 | 261 | 67 | 138 | 28 | 26 |
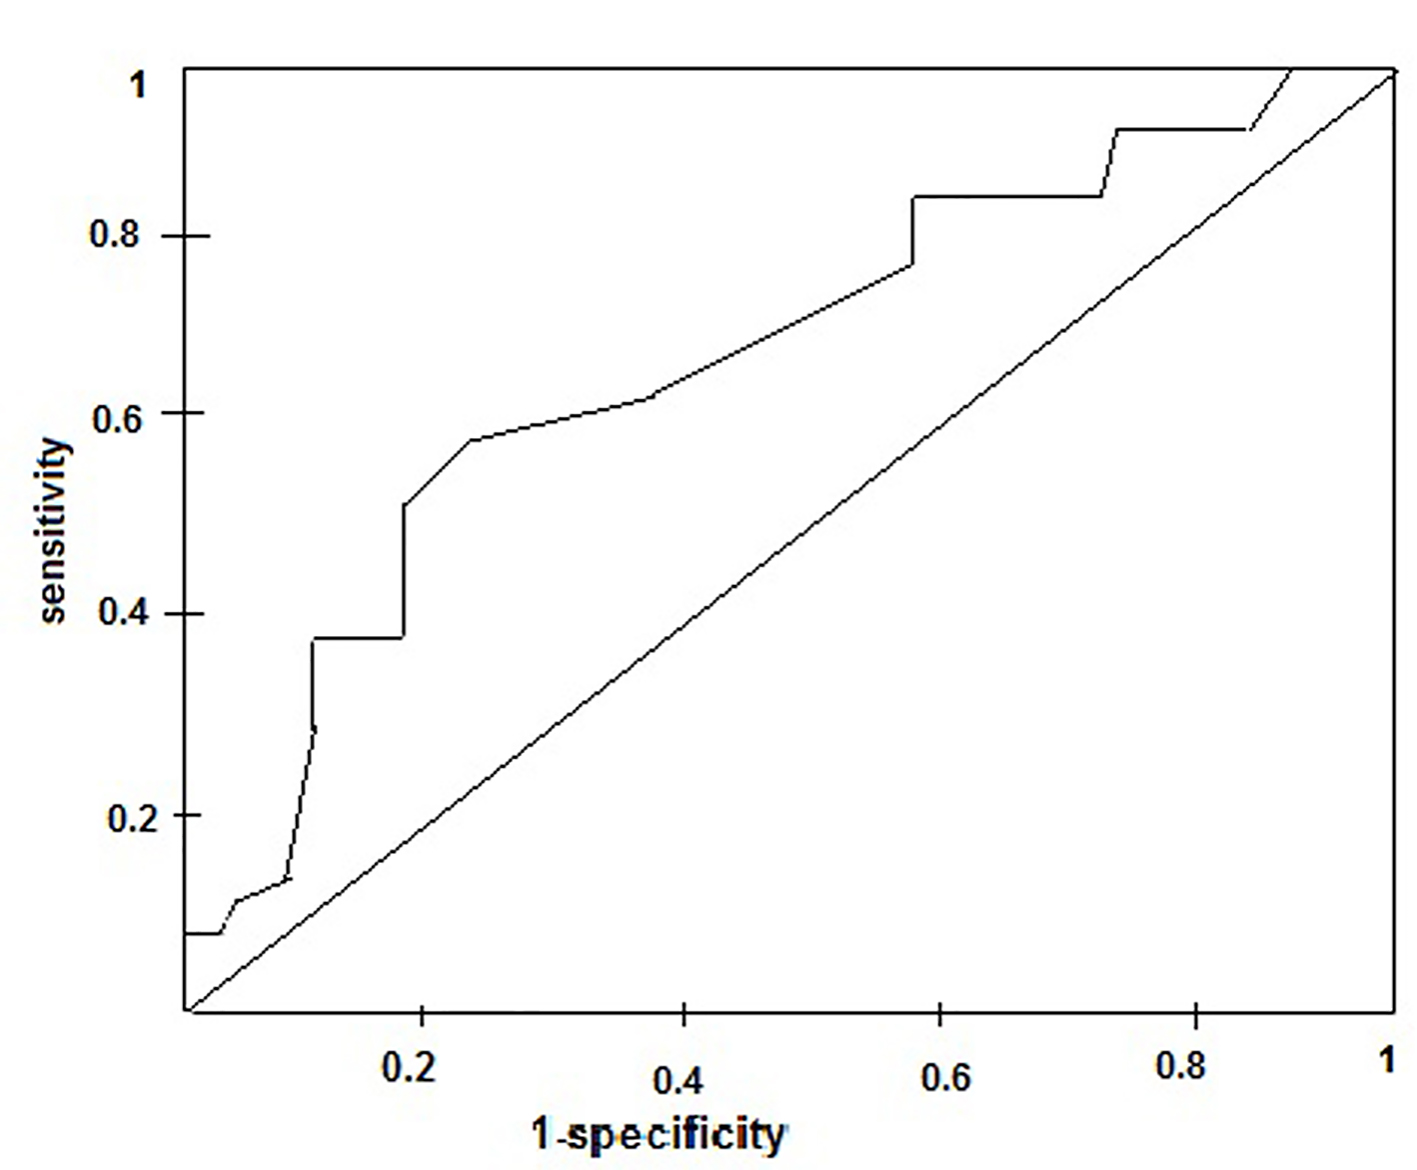
| Area under the curve (AUC) | 0.07 |
| 95% CI of AUC | 0.58 - 0.82 |
| P-value | 0.002* |
| Cut-off | 4.65 |
| Sensitivity | 71.6% |
| Specificity | 73.1% |