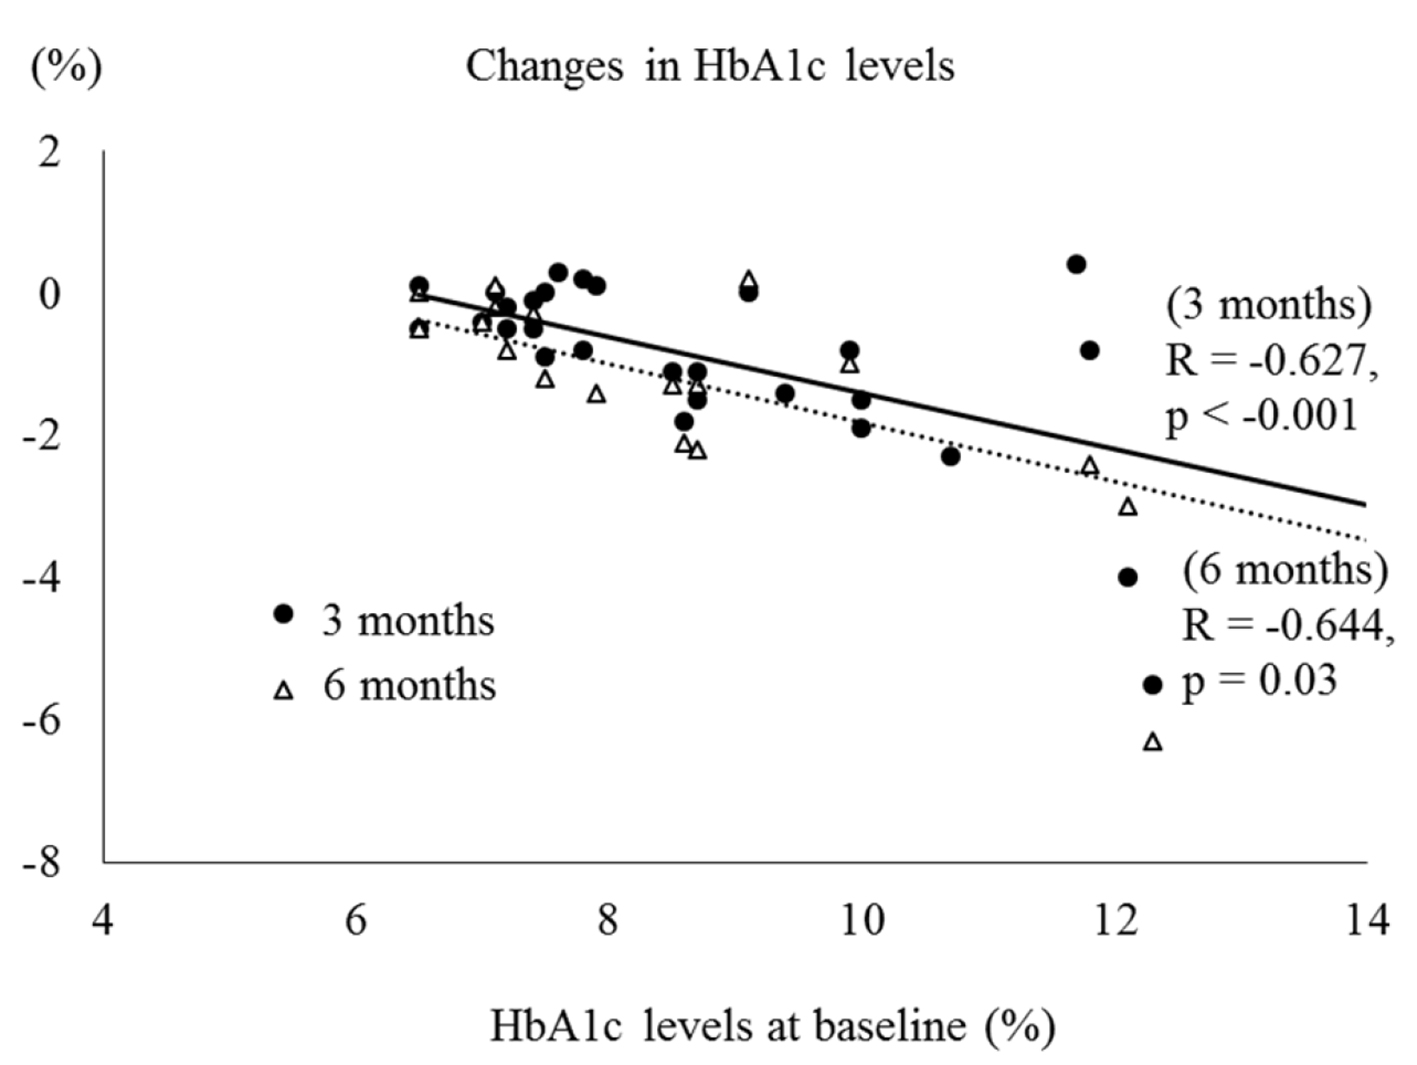
Figure 1. Correlation between HbA1c levels at baseline and changes in HbA1c levels.
| Journal of Clinical Medicine Research, ISSN 1918-3003 print, 1918-3011 online, Open Access |
| Article copyright, the authors; Journal compilation copyright, J Clin Med Res and Elmer Press Inc |
| Journal website http://www.jocmr.org |
Original Article
Volume 8, Number 3, March 2016, pages 237-243
Effects of Sodium-Glucose Cotransporter 2 Inhibitors on Metabolic Parameters in Patients With Type 2 Diabetes: A Chart-Based Analysis
Figures
Tables
| Age | 48 ± 10 |
| Sex (male/female) | 18/32 |
| Body height (cm) | 161 ± 8 |
| Body weight (kg) | 84.9 ± 17.6 |
| Body mass index (BMI) (kg/m2) | 32.1 ± 5.9 |
| Systolic blood pressure (mm Hg) | 130 ± 15 |
| Diastolic blood pressure (mm Hg) | 80 ± 11 |
| Plasma glucose (mg/dL) | 180 ± 75 |
| Hemoglobin A1c (%) | 8.9 ± 2.0 |
| Dapagliflozin 5 mg | 16 (32%) |
| Ipragliflozin 25 mg | 4 (8%) |
| Ipragliflozin 50 mg | 10 (20%) |
| Tofogliflozin 20 mg | 7 (14%) |
| Luseogliflozin 2.5 mg | 11 (22%) |
| Canagliflozin 100 mg | 1 (2%) |
| Empagliflozin 10 mg | 1 (2%) |
| Medications | Pre-treatment (n = 50) | 1 month (n = 50) | 2 months (n = 41) | 3 months (n = 37) | 6 months (n = 23) |
|---|---|---|---|---|---|
| ACEi: angiotensin converting enzyme inhibitor; ARB: angiotensin receptor blockers; α-GI: alpha-glucosidase inhibitor; DPP-4: dipeptidyl peptidase-4; GLP-1: glucagon-like peptide 1. | |||||
| Biguanides | 41 | 39 | 35 | 30 | 19 |
| Thiazolidinediones | 17 | 17 | 16 | 14 | 8 |
| DPP-4 inhibitors | 26 | 24 | 21 | 18 | 10 |
| Sulfonylurea | 11 | 9 | 6 | 5 | 4 |
| α-GI | 6 | 7 | 7 | 6 | 2 |
| Glinides | 2 | 1 | 1 | 1 | 2 |
| GLP-1 analogues | 7 | 8 | 7 | 6 | 9 |
| Insulin | 15 | 14 | 12 | 11 | 5 |
| ACEi/ARB | 19 | 20 | 18 | 16 | 11 |
| Statins | 30 | 30 | 27 | 22 | 13 |
| n | Pre-treatment | 1 month | P | |
|---|---|---|---|---|
| Body weight (kg) | 41 | 85.0 (18.7) | 83.3 (18.1) | < 0.001 |
| Systolic blood pressure (mm Hg) | 31 | 129 (14) | 124 (15) | 0.126 |
| Diastolic blood pressure (mm Hg) | 31 | 80 (10) | 73 (17) | 0.014 |
| Plasma glucose (mg/dL) | 46 | 180 (78) | 168 (81) | 0.368 |
| HbA1c (%) | 41 | 9.0 (2.0) | 8.2 (1.7) | < 0.001 |
| HDL-C (mg/dL) | 45 | 48 (11) | 48 (12) | 0.696 |
| TG (mg/dL) | 45 | 221 (153) | 269 (291) | 0.072 |
| LDL-C (mg/dL) | 21 | 120 (39) | 121 (36) | 0.905 |
| Non-HDL-C (mg/dL) | 37 | 142 (30) | 149 (36) | 0.110 |
| AST (IU/L) | 44 | 39 (27) | 39 (31) | 0.900 |
| ALT (IU/L) | 44 | 50 (40) | 53 (48) | 0.241 |
| eGFR (mL/min/1.73 m2) | 45 | 94 (36) | 89 (31) | 0.012 |
| Hematocrit (%) | 44 | 41.2 (4.2) | 42.8 (4.4) | < 0.001 |
| n | Pre-treatment | 2 months | P | |
|---|---|---|---|---|
| Body weight (kg) | 28 | 86.2 (19.3) | 84.3 (19.2) | < 0.001 |
| Systolic blood pressure (mm Hg) | 23 | 131 (13) | 124 (15) | 0.051 |
| Diastolic blood pressure (mm Hg) | 23 | 79 (10) | 76 (10) | 0.615 |
| Plasma glucose (mg/dL) | 34 | 187 (78) | 161 (63) | 0.006 |
| HbA1c (%) | 28 | 8.7 (1.6) | 7.8 (1.4) | < 0.001 |
| HDL-C (mg/dL) | 33 | 47 (10) | 47 (10) | 0.713 |
| TG (mg/dL) | 33 | 197 (106) | 189 (92) | 0.567 |
| LDL-C (mg/dL) | 13 | 123 (46) | 122 (41) | 0.809 |
| Non-HDL-C (mg/dL) | 28 | 137 (28) | 136 (32) | 0.875 |
| AST (IU/L) | 33 | 42 (30) | 35 (20) | 0.051 |
| ALT (IU/L) | 32 | 54 (46) | 49 (39) | 0.149 |
| eGFR (mL/min/1.73 m2) | 33 | 95 (39) | 92 (35) | 0.052 |
| Hematocrit (%) | 31 | 41.0 (4.2) | 42.8 (3.9) | 0.003 |
| n | Pre-treatment | 3 months | P | |
|---|---|---|---|---|
| Body weight (kg) | 31 | 84.4 (18.4) | 82.0 (17.9) | 0.002 |
| Systolic blood pressure (mm Hg) | 26 | 131 (15) | 128 (16) | 0.402 |
| Diastolic blood pressure (mm Hg) | 26 | 76 (10) | 75 (9) | 0.615 |
| Plasma glucose (mg/dL) | 35 | 189 (84) | 160 (58) | 0.032 |
| HbA1c (%) | 30 | 8.9 (2.0) | 7.9 (1.6) | < 0.001 |
| HDL-C (mg/dL) | 32 | 49 (11) | 51 (15) | 0.195 |
| TG (mg/dL) | 32 | 199 (112) | 197 (145) | 0.922 |
| LDL-C (mg/dL) | 17 | 122 (40) | 119 (37) | 0.641 |
| Non-HDL-C (mg/dL) | 24 | 143 (29) | 137 (30) | 0.180 |
| AST (IU/L) | 32 | 40 (29) | 31 (23) | < 0.001 |
| ALT (IU/L) | 32 | 50 (43) | 43 (38) | 0.033 |
| eGFR (mL/min/1.73 m2) | 33 | 98 (38) | 94 (33) | 0.137 |
| Hematocrit (%) | 32 | 41.1 (4.0) | 43.1 (3.8) | < 0.001 |
| n | Pre-treatment | 6 months | P | |
|---|---|---|---|---|
| Body weight (kg) | 19 | 89.6 (19.1) | 87.6 (19.1) | 0.023 |
| Systolic blood pressure (mm Hg) | 15 | 132 (14) | 131 (16) | 0.896 |
| Diastolic blood pressure (mm Hg) | 15 | 78 (12) | 80 (10) | 0.465 |
| Plasma glucose (mg/dL) | 23 | 192 (97) | 158 (62) | 0.017 |
| HbA1c (%) | 20 | 8.8 (2.3) | 7.5 (1.7) | 0.001 |
| HDL-C (mg/dL) | 22 | 49 (12) | 51 (16) | 0.499 |
| TG (mg/dL) | 22 | 197 (108) | 202 (110) | 0.815 |
| LDL-C (mg/dL) | 10 | 118 (45) | 102 (37) | 0.162 |
| Non-HDL-C (mg/dL) | 16 | 142 (24) | 140 (30) | 0.791 |
| AST (IU/L) | 21 | 38 (21) | 29 (13) | 0.006. |
| ALT (IU/L) | 21 | 46 (34) | 38 (25) | 0.035 |
| eGFR (mL/min/1.73 m2) | 23 | 97 (40) | 94 (30) | 0.511 |
| Hematocrit (%) | 22 | 41.9 (3.9) | 43.8 (4.1) | < 0.001 |