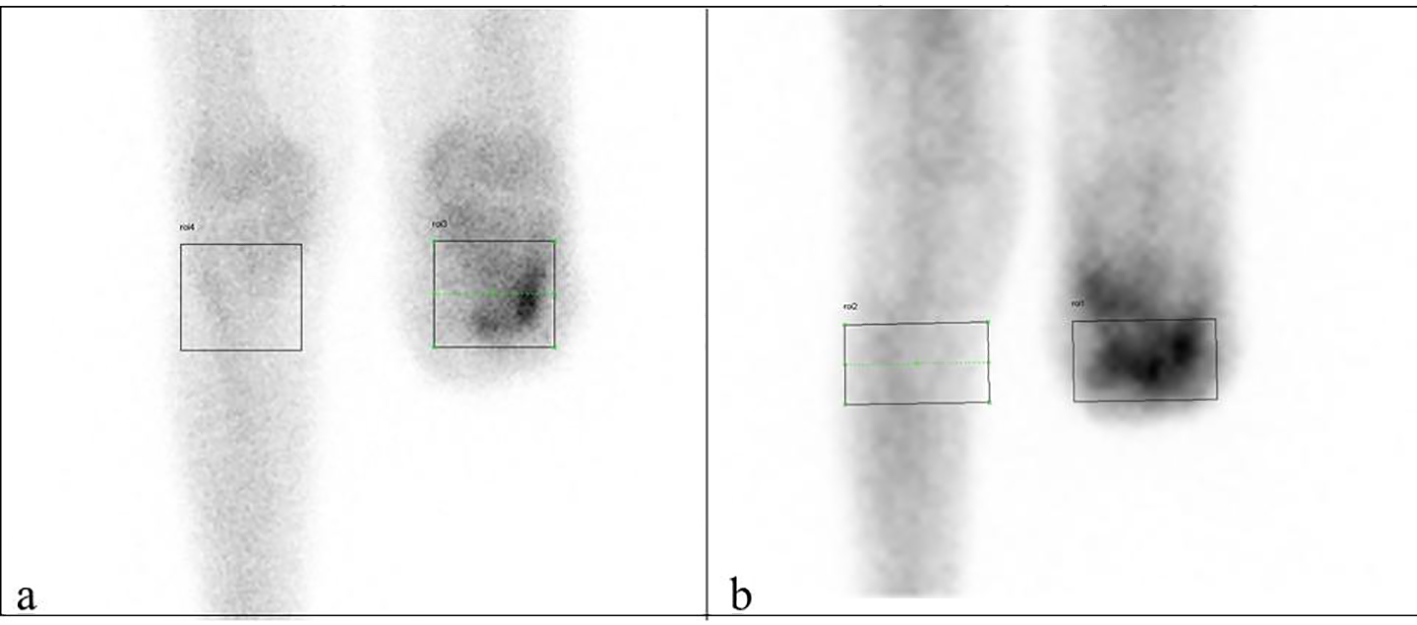
Figure 1. Late (a) and early (b) phase ROI samples.
| Journal of Clinical Medicine Research, ISSN 1918-3003 print, 1918-3011 online, Open Access |
| Article copyright, the authors; Journal compilation copyright, J Clin Med Res and Elmer Press Inc |
| Journal website http://www.jocmr.org |
Original Article
Volume 8, Number 3, March 2016, pages 225-230
Scintigraphic Evaluation of the Stump Region After Extremity Amputation and the Effect of Scintigraphy on Treatment
Figures
Tables
| Variables | n (%) |
|---|---|
| Gender | |
| Male | 51 (75%) |
| Female | 17 (25%) |
| Cause of amputation | |
| Trauma (accident) | 19 (27.9%) |
| Diabetes mellitus | 48 (70.6%) |
| Compartment syndrome | 1 (1.5%) |
| Amputation region | |
| Toes | 20 (29.4%) |
| Foot | 3 (4.4%) |
| Tibia/under knee | 12 (17.6%) |
| Femur | 17 (25%) |
| Upper extremity | 16 (23.5%) |
| Result of scintigraphy | |
| Osteomyelitis | 34 (50%) |
| Soft-tissue infection | 16 (23.5%) |
| Secondary to surgery | 8 (11.8%) |
| Chronic osteomyelitis | 1 (1.5%) |
| Normal | 9 (13.2%) |
| Treatment modality | |
| Antibiotics | 41 (60.3%) |
| No treatment | 9 (13.2%) |
| Surgery | 16 (23.5%) |
| Hyperbaric oxygen therapy | 2 (3%) |
| Diagnosis | n | Early ratio | P value | Late ratio | P value |
|---|---|---|---|---|---|
| Osteomyelitis | 34 | 2.34 ± 1.67 | 0.025 | 3.47 ± 1.95 | 0.003 |
| Soft tissue infection | 16 | 1.55 ± 0.89 | 0.12 | 2.3 ± 1.04 | 0.017 |
| Secondary to surgery | 8 | 1.47 ± 0.85 | 0.19 | 2.77 ± 1.41 | 0.025 |
| Normal | 9 | 1.03 ± 0.43 | 1.35 ± 0.49 |