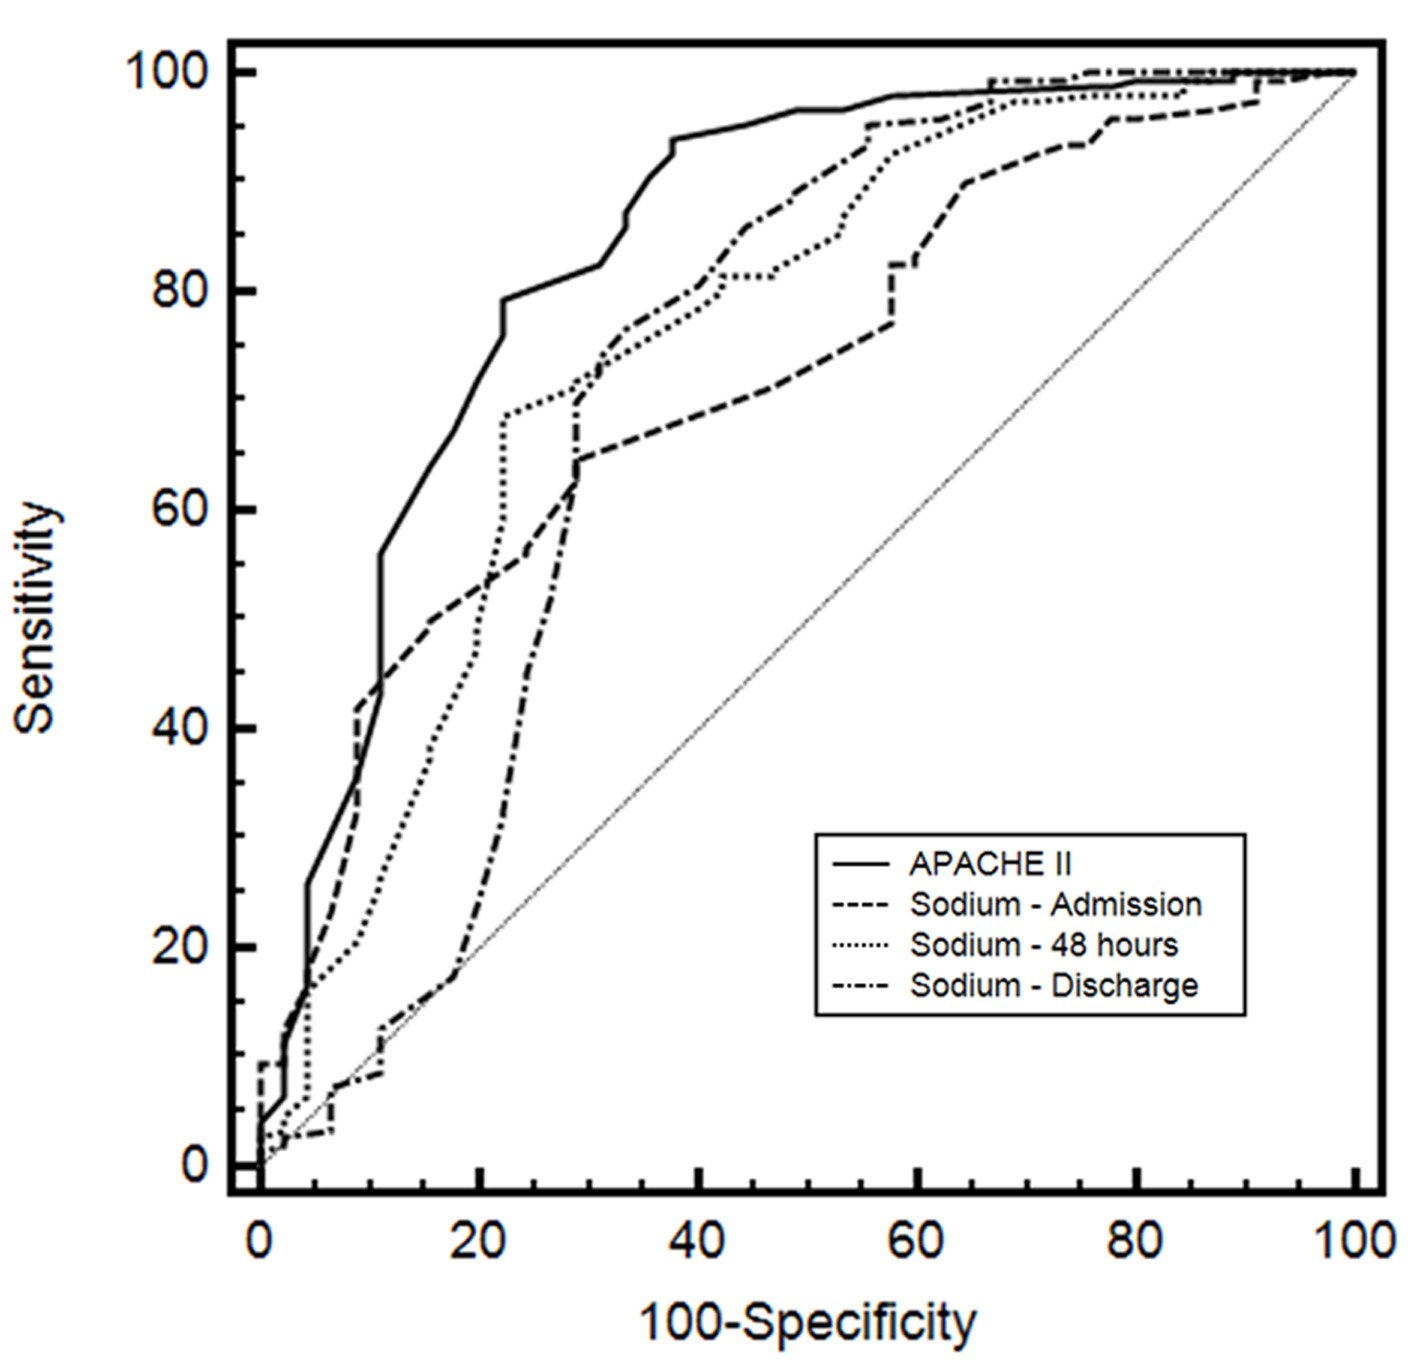
Figure 1. Receiver operating characteristic (ROC) curves of Acute Physiology and Chronic Health Evaluation II (APACHE II), serum sodium level on admission, sodium 48 h after admission and sodium at discharge of patient from ICU.
| Journal of Clinical Medicine Research, ISSN 1918-3003 print, 1918-3011 online, Open Access |
| Article copyright, the authors; Journal compilation copyright, J Clin Med Res and Elmer Press Inc |
| Journal website http://www.jocmr.org |
Original Article
Volume 8, Number 2, February 2016, pages 141-146
Are the Dysnatremias a Permanent Threat to the Critically Ill Patients?
Figures
Tables
| Patients (n = 195) | Survivors (n = 152) | Non-suvivors (n = 43) | |
|---|---|---|---|
| *Values expressed as mean ± standard deviation. | |||
| Sex (M/F) | 121/74 | 95/57 | 26/17 |
| Age (years) | 51.8 ± 17.1 | 51.5 ± 17.3 | 52.9 ± 16.8 |
| APACHE II score | 16.3 ± 8.3 | 13.6 ± 6.1 | 25.5 ± 8.5 |
| Death risk (%) | 25.3 ± 24.1 | 18 ± 17.3 | 50.6 ± 27.7 |
| Mechanical ventilation (days) | 2.6 ± 4.8 | 1.6 ± 3.6 | 6.13 ± 6.0 |
| ICU length of stay (days) | 4.3 ± 5.6 | 3.24 ± 3.8 | 8.2 ± 8.7 |
| Hospital length of stay (days) | 24 ± 21 | 23 ± 22 | 24 ± 20 |
| ICU mortality (%) | 22 | ||
| Hospital mortality (%) | 31.7 | ||
| Oncologic surgery | 61 (31.3%) | 53 (27.2%) | 8 (4.1%) |
| Non-oncologic surgery | 134 (68.7%) | 99 (50.7%) | 35 (18%) |
| Cardiovascular | 18 (9.3%) | 13 (6.7%) | 5 (2.5%) |
| Gastrointestinal | 114 (58.5%) | 86 (44.1%) | 28 (14.4%) |
| Neurosurgery | 6 (3%) | 5 (2.5%) | 1 (0.5%) |
| Orthopaedic | 11 (5.6%) | 11 (5.6%) | 0 |
| Thorax | 19 (9.7%) | 14 (7.2%) | 5 (2.5%) |
| Obstetrics and gynecology | 9 (4.6%) | 9 (4.6%) | 0 |
| Urology | 17 (8.7%) | 13 (6.7%) | 4 (2%) |
| Others | 1 (0.5%) | 1 (0.5%) | 0 |
| Variable | AUC | 95% CI | P value |
|---|---|---|---|
| Hypothesis test of diagnostic accuracy P < 0.05 (Wilcoxon test) [15]. | |||
| APACHE II | 0.841 | 0.782 - 0.889 | 0.03 |
| Sodium admission (mmol/L) | 0.721 | 0.653 - 0.783 | 0.04 |
| Sodium 48 h (mmol/L) | 0.754 | 0.687 - 0.812 | 0.04 |
| Sodium discharge (mmol/L) | 0.720 | 0.651 - 0.782 | 0.05 |
| Patients (n = 195) | Na < 136* | Na 136 - 144 | Na > 144 |
|---|---|---|---|
| *Values expressed as mmol/L. | |||
| Sex (M/F) | 44/24 | 62/42 | 14/9 |
| Age (years) | 55 ± 13 | 50 ± 14 | 50 ± 13 |
| APACHE II score | 14 ± 5 | 21 ± 14 | 22 ± 6 |
| Survivors | 64 | 78 | 10 |
| Non-survivors | 4 | 26 | 13 |
| n | 68 | 104 | 23 |
| Percentage (%) | 34.8 | 53.4 | 11.7 |