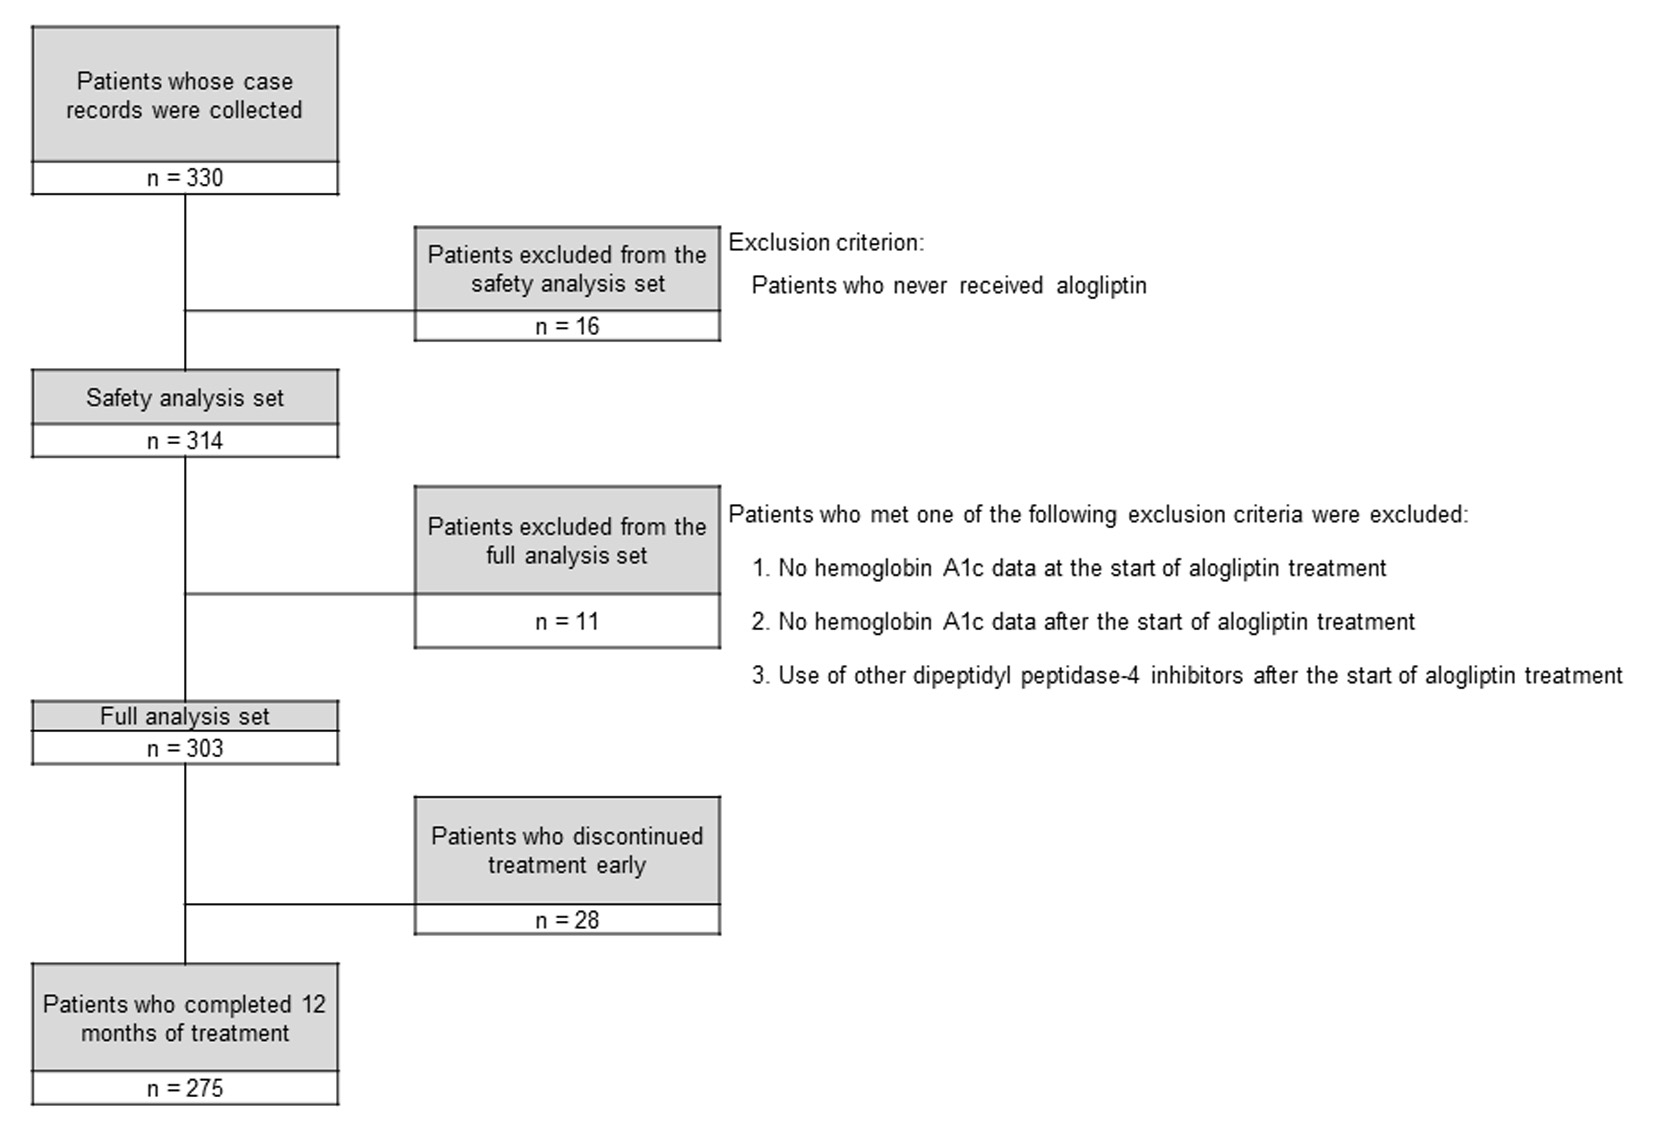
Figure 1. Disposition of the subjects.
| Journal of Clinical Medicine Research, ISSN 1918-3003 print, 1918-3011 online, Open Access |
| Article copyright, the authors; Journal compilation copyright, J Clin Med Res and Elmer Press Inc |
| Journal website http://www.jocmr.org |
Original Article
Volume 8, Number 2, February 2016, pages 130-140
Efficacy and Safety of Alogliptin in Patients With Type 2 Diabetes: Analysis of the ATTAK-J Study
Figures
Tables
| Item | Male, 170 (56.1%), mean ± SD | Female, 127 (41.9%), median (range) | Unknown, 6 (2.0%), N |
|---|---|---|---|
| At the start of administration | |||
| Age (years) | 67.3 ± 11.9 | 69.0 (29 - 91) | 290 |
| Height (cm) | 160.70 ± 9.93 | 161.00 (137.4 - 184.0) | 235 |
| Weight (kg) | 64.814 ± 14.065 | 63.300 (37.10 - 130.00) | 281 |
| Body mass index (kg/m2) | 24.98 ± 4.10 | 24.66 (16.3 - 41.5) | 233 |
| Systolic blood pressure (mm Hg) | 135.2 ± 18.6 | 132.0 (98 - 213) | 297 |
| Diastolic blood pressure (mm Hg) | 76.2 ± 11.5 | 76.0 (48 - 124) | 297 |
| Hemoglobin A1c (%) | 7.37 ± 1.21 | 7.10 (4.8 - 11.9) | 303 |
| Blood glucose (fasting) (mg/dL) | 152.4 ± 47.7 | 143.5 (77 - 339) | 86 |
| Blood glucose (postprandial) (mg/dL) | 184.4 ± 66.4 | 176.0 (66 - 516) | 105 |
| Estimated duration of diabetes (years) | 10.3 ± 7.6 | 9.0 (0 - 40) | 176 |
| Yes | No | Unknown/no data | |
| Family history | 49 (16.2%) | 94 (31.0%) | 160 (52.8%) |
| Smoking history | 58 (19.1%) | 118 (38.9%) | 127 (41.9%) |
| Alcohol history | 86 (28.4%) | 98 (32.3%) | 119 (39.3%) |
| Complications | |||
| Diabetic retinopathy | 23 (7.6%) | 225 (74.3%) | 55 (18.2%) |
| Diabetic neuropathy | 26 (8.6%) | 222 (73.3%) | 55 (18.2%) |
| Diabetic nephropathy | 34 (11.2%) | 219 (72.3%) | 50 (16.5%) |
| Cerebrovascular accident (cerebral infarction/cerebral hemorrhage) | 21 (6.9%) | 224 (73.9%) | 58 (19.1%) |
| Myocardial infarction | 17 (5.6%) | 228 (75.2%) | 58 (19.1%) |
| Angina | 33 (10.9%) | 213 (70.3%) | 57 (18.8%) |
| Arteriosclerosis obliterans (lower limbs) | 10 (3.3%) | 222 (73.3%) | 71 (23.4%) |
| Hypertension | 180 (59.4%) | 83 (27.4%) | 40 (13.2%) |
| Dyslipidemia | 169 (55.8%) | 90 (29.7%) | 44 (14.5%) |
| Fatty liver | 49 (16.2%) | 178 (58.7%) | 76 (25.1%) |
| Others | 76 (25.1%) | 153 (50.5%) | 74 (24.4%) |
| Assessment times (baseline = start of alogliptin treatment) | ||||||
|---|---|---|---|---|---|---|
| Before administration | Baseline | Month 3 | Month 6 | Month 9 | Month 12 | |
| ACE: angiotensin-converting enzyme; ARB: angiotensin receptor blocker; DPP-4: dipeptidyl peptidase-4. | ||||||
| Patients receiving the study drug in the full analysis set | 303 (100.0%) | 303 (100.0%) | 303 (100.0%) | 290 (100.0%) | 278 (100.0%) | 275 (100.0%) |
| Antidiabetic drugs | ||||||
| Total | 225 (74.3%) | 303 (100.0%) | 303 (100.0%) | 290 (100.0%) | 278 (100.0%) | 275 (100.0%) |
| Alogliptin | - | 303 (100.0%) | 303 (100.0%) | 290 (100.0%) | 278 (100.0%) | 275 (100.0%) |
| DPP-4 inhibitors | 80 (26.4%) | 0 (0.0%) | 0 (0.0%) | 0 (0.0%) | 0 (0.0%) | 0 (0.0%) |
| Glimepiride | 94 (31.0%) | 90 (29.7%) | 95 (31.4%) | 87 (30.0%) | 81 (29.1%) | 83 (30.2%) |
| Glibenclamide | 10 (3.3%) | 7 (2.3%) | 7 (2.3%) | 7 (2.4%) | 7 (2.5%) | 7 (2.5%) |
| Gliclazide | 15 (5.0%) | 13 (4.3%) | 14 (4.6%) | 16 (5.5%) | 16 (5.8%) | 17 (6.2%) |
| Metformin | 73 (24.1%) | 82 (27.1%) | 91 (30.0%) | 91 (31.4%) | 93 (33.5%) | 96 (34.9%) |
| Pioglitazone | 59 (19.5%) | 52 (17.2%) | 60 (19.8%) | 56 (19.3%) | 50 (18.0%) | 46 (16.7%) |
| α-Glucosidase inhibitors | 75 (24.8%) | 48 (15.8%) | 48 (15.8%) | 45 (15.5%) | 40 (14.4%) | 38 (13.8%) |
| Glinides | 18 (5.9%) | 1 (0.3%) | 1 (0.3%) | 1 (0.3%) | 1 (0.4%) | 1 (0.4%) |
| Insulin | 1 (0.3%) | 0 (0.0%) | 0 (0.0%) | 0 (0.0%) | 1 (0.4%) | 1 (0.4%) |
| Lipid-lowering agents | ||||||
| Total | 133 (43.9%) | 140 (46.2%) | 145 (47.9%) | 146 (50.3%) | 144 (51.8%) | 143 (52.0%) |
| Statins | 116 (38.3%) | 123 (40.6%) | 129 (42.6%) | 131 (45.2%) | 130 (46.8%) | 129 (46.9%) |
| Others | 29 (9.6%) | 29 (9.6%) | 31 (10.2%) | 31(10.7%) | 31(11.2%) | 32 (11.6%) |
| Antihypertensive agents | ||||||
| Total | 168 (55.4%) | 174 (57.4%) | 177 (58.4%) | 176 (60.7%) | 171 (61.5%) | 174 (63.3%) |
| ARB | 122 (40.3%) | 125 (41.3%) | 127 (41.9%) | 128 (44.1%) | 124 (44.6%) | 127 (46.2%) |
| Ca antagonists | 113 (37.3%) | 116 (38.3%) | 119 (39.3%) | 117 (40.3%) | 116 (41.7%) | 118 (42.9%) |
| Diuretics | 22 (7.3%) | 20 (6.6%) | 23(7.6%) | 23(7.9%) | 21 (7.6%) | 22 (8.0%) |
| ACE inhibitors | 14 (4.6%) | 15 (5.0%) | 14 (4.6%) | 13 (4.5%) | 13 (4.7%) | 13 (4.7%) |
| Renin inhibitors | 4 (1.3%) | 3 (1.0%) | 0 (0.0%) | 0 (0.0%) | 0 (0.0%) | 0 (0.0%) |
| α-blockers | 8 (2.6%) | 8 (2.6%) | 10 (3.3%) | 10 (3.4%) | 10 (3.6%) | 11 (4.0%) |
| β-blocker | 6 (2.0%) | 6 (2.0%) | 7 (2.3%) | 8 (2.8%) | 8 (2.9%) | 8 (2.9%) |
| αβ-blockers | 11 (3.6%) | 13 (4.3%) | 13 (4.3%) | 13 (4.5%) | 12 (4.3%) | 11 (4.0%) |
| Aldosterone blockers | 3 (1.0%) | 3 (1.0%) | 4 (1.3%) | 3(1.0%) | 3 (1.1%) | 3 (1.1%) |
| Others | 0 (0.0%) | 0 (0.0%) | 0 (0.0%) | 0 (0.0%) | 0 (0.0%) | 0 (0.0%) |
| Explanatory variables | Model 1: baseline characteristics (N = 110) | Model 2: baseline characteristics + concurrent treatment (N = 76) | ||||||||
|---|---|---|---|---|---|---|---|---|---|---|
| Estimate | Standard error | 95% confidence interval | P value | Estimate | Standard error | 95% confidence interval | P value | |||
| Lower limit | Upper limit | Lower limit | Upper limit | |||||||
| *P < 0.050. | ||||||||||
| Baseline characteristics | ||||||||||
| Gender (female = 0; male = 1) | 0.0213 | 0.1683 | -0.3125 | 0.3551 | 0.8996 | -0.0983 | 0.1833 | -0.4645 | 0.2679 | 0.5935 |
| Age (years) | -0.0107 | 0.0083 | -0.0271 | 0.0056 | 0.1963 | -0.0168 | 0.0092 | -0.0352 | 0.0015 | 0.0718 |
| Duration of diabetes (years) | 0.0366 | 0.0113 | 0.0143 | 0.0589 | 0.0015* | 0.0156 | 0.0134 | -0.0112 | 0.0425 | 0.2490 |
| Hemoglobin A1c (%) | -0.8660 | 0.0729 | -1.0106 | -0.7214 | < 0.0001* | -0.9264 | 0.0749 | -1.0761 | -0.7767 | < 0.0001* |
| Body mass index (kg/m2) | 0.0001 | 0.0243 | -0.0481 | 0.0482 | 0.9983 | -0.0207 | 0.0244 | -0.0695 | 0.0281 | 0.4007 |
| Use of concomitant drugs in month 12: no = 0; yes = 1 | ||||||||||
| Sulfonylureas | 0.4211 | 0.1897 | 0.0420 | 0.8001 | 0.0300* | |||||
| Biguanides | 0.2787 | 0.1911 | -0.1030 | 0.6605 | 0.1496 | |||||
| Thiazolidinediones | -0.1891 | 0.2282 | -0.6450 | 0.2667 | 0.4102 | |||||
| α-Glucosidase inhibitors | -0.1456 | 0.2218 | -0.5887 | 0.2976 | 0.5140 | |||||
| Compliance with concurrent treatment in month 12: poor = 0; fair or good = 1 | ||||||||||
| Diet therapy | -1.2210 | 0.3144 | -1.8490 | -0.5929 | 0.0002* | |||||
| Exercise therapy | -0.4497 | 0.2735 | -0.9961 | 0.0968 | 0.1051 | |||||
| Item | Time after starting alogliptin (months) | Measured values | Changes of measured values | |||||||||
|---|---|---|---|---|---|---|---|---|---|---|---|---|
| N | Mean | SD | Median | Maximum | Minimum | Point estimate | SE | 95% confidence interval | P value‡ | |||
| Lower limit | Upper limit | |||||||||||
| ‡Linear mixed-effects models (covariance structure = unstructured) were used and multiplicity was adjusted by the Dunnett-Hsu method. *P < 0.050. SD: standard deviation; SE: standard error. | ||||||||||||
| Blood glucose (fasting) (mg/dL) | 0 | 98 | 150.2 | 46.9 | 339 | 140.0 | 77 | - | - | - | - | - |
| 3 | 79 | 137.8 | 38.4 | 294 | 131.0 | 80 | -11.07 | 5.08 | -23.53 | 1.39 | 0.0954 | |
| 6 | 71 | 131.4 | 27.9 | 204 | 130.0 | 72 | -16.39 | 3.64 | -25.34 | -7.45 | < 0.0001* | |
| 9 | 73 | 135.2 | 35.7 | 290 | 127.0 | 90 | -15.26 | 4.77 | -26.96 | -3.56 | 0.0062* | |
| 12 | 68 | 133.6 | 41.9 | 315 | 123.5 | 84 | -16.79 | 5.46 | -30.19 | -3.38 | 0.0092* | |
| Blood glucose (postprandial) (mg/dL) | 0 | 118 | 185.7 | 68.1 | 516 | 174.5 | 66 | - | - | - | - | - |
| 3 | 107 | 158.6 | 45.7 | 327 | 154.0 | 83 | -23.27 | 5.50 | -36.73 | -9.81 | 0.0002* | |
| 6 | 108 | 161.7 | 59.5 | 364 | 147.5 | 71 | -19.05 | 5.72 | -33.05 | -5.06 | 0.0040* | |
| 9 | 93 | 163.9 | 54.5 | 362 | 152.0 | 59 | -14.31 | 6.66 | -30.62 | 1.99 | 0.1009 | |
| 12 | 114 | 170.6 | 60.9 | 413 | 155.0 | 76 | -10.76 | 6.52 | -26.70 | 5.19 | 0.2705 | |
| Body mass index (kg/m2) | 0 | 230 | 25.04 | 4.08 | 41.5 | 24.67 | 16.3 | - | - | - | - | - |
| 3 | 187 | 24.76 | 4.02 | 39.8 | 24.40 | 15.6 | -0.07 | 0.05 | -0.20 | 0.07 | 0.5238 | |
| 6 | 176 | 24.81 | 4.03 | 38.1 | 24.49 | 15.2 | -0.02 | 0.09 | -0.25 | 0.22 | 0.9992 | |
| 9 | 155 | 24.71 | 3.80 | 39.2 | 24.47 | 15.0 | 0.04 | 0.08 | -0.16 | 0.24 | 0.9572 | |
| 12 | 175 | 25.00 | 4.19 | 43.6 | 24.73 | 15.0 | 0.00 | 0.09 | -0.21 | 0.21 | 1.0000 | |
| Systolic blood pressure (mm Hg) | 0 | 297 | 135.2 | 18.6 | 213 | 132.0 | 98 | - | - | - | - | - |
| 3 | 286 | 133.0 | 15.7 | 183 | 132.0 | 94 | -2.15 | 0.94 | -4.43 | 0.13 | 0.0704 | |
| 6 | 265 | 133.7 | 16.2 | 197 | 132.0 | 98 | -1.64 | 0.98 | -4.02 | 0.74 | 0.2527 | |
| 9 | 248 | 132.6 | 14.8 | 193 | 132.0 | 97 | -2.60 | 1.09 | -5.23 | 0.04 | 0.0546 | |
| 12 | 261 | 133.0 | 16.1 | 211 | 132.0 | 90 | -2.19 | 1.10 | -4.85 | 0.47 | 0.1349 | |
| Diastolic blood pressure (mm Hg) | 0 | 297 | 76.2 | 11.5 | 124 | 76.0 | 48 | - | - | - | - | - |
| 3 | 286 | 75.4 | 10.8 | 110 | 75.0 | 45 | -0.64 | 0.63 | -2.18 | 0.90 | 0.6896 | |
| 6 | 264 | 74.9 | 10.4 | 112 | 75.0 | 43 | -1.16 | 0.59 | -2.60 | 0.27 | 0.1480 | |
| 9 | 247 | 74.7 | 10.7 | 112 | 74.0 | 50 | -1.47 | 0.68 | -3.14 | 0.19 | 0.0994 | |
| 12 | 261 | 75.4 | 10.4 | 102 | 75.0 | 50 | -0.88 | 0.59 | -2.31 | 0.56 | 0.3626 | |
| Item | Time after starting alogliptin (months) | Measured values | Changes of measured values | |||||||||
|---|---|---|---|---|---|---|---|---|---|---|---|---|
| N | Mean | SD | Median | Maximum | Minimum | Point estimate | SE | 95% confidence interval | P value‡ | |||
| Lower limit | Upper limit | |||||||||||
| ‡Linear mixed-effects models (covariance structure = unstructured) were used and multiplicity was adjusted by the Dunnett-Hsu method. *P < 0.050. eGFR: estimated glomerular filtration rate; γ-GTP: γ-glutamyl transpeptidase; GOT: glutamate oxaloacetate transaminase; GTP: glutamate pyruvate transaminase; SD: standard deviation; SE: standard error. | ||||||||||||
| GOT (IU/L) | 0 | 217 | 27.8 | 16.4 | 136 | 22.0 | 11 | - | - | - | - | - |
| 3 | 176 | 27.2 | 14.8 | 112 | 22.0 | 12 | -1.32 | 0.86 | -3.41 | 0.77 | 0.3332 | |
| 6 | 171 | 26.1 | 13.1 | 97 | 21.0 | 11 | -1.21 | 1.01 | -3.68 | 1.26 | 0.5509 | |
| 9 | 132 | 27.2 | 16.9 | 143 | 23.0 | 11 | -0.06 | 1.03 | -2.58 | 2.47 | 1.0000 | |
| 12 | 164 | 27.5 | 16.3 | 122 | 23.0 | 12 | 0.16 | 1.21 | -2.79 | 3.12 | 0.9997 | |
| GPT (IU/L) | 0 | 239 | 29.8 | 24.5 | 179 | 21.0 | 6 | - | - | - | - | - |
| 3 | 205 | 27.8 | 20.7 | 138 | 20.0 | 6 | -2.48 | 0.99 | -4.91 | -0.06 | 0.0432* | |
| 6 | 190 | 27.5 | 24.2 | 237 | 20.0 | 5 | -2.27 | 1.48 | -5.90 | 1.36 | 0.3482 | |
| 9 | 157 | 27.4 | 17.9 | 109 | 21.0 | 8 | -2.04 | 1.13 | -4.82 | 0.74 | 0.2160 | |
| 12 | 185 | 28.5 | 23.6 | 188 | 21.0 | 8 | -1.77 | 1.37 | -5.14 | 1.60 | 0.5063 | |
| γ-GTP (IU/L) | 0 | 218 | 47.9 | 59.6 | 467 | 30.0 | 9 | - | - | - | - | - |
| 3 | 177 | 48.2 | 63.1 | 407 | 29.0 | 8 | -1.83 | 1.40 | -5.28 | 1.62 | 0.5098 | |
| 6 | 166 | 48.7 | 55.8 | 365 | 30.0 | 8 | -2.70 | 2.45 | -8.75 | 3.34 | 0.6536 | |
| 9 | 136 | 56.5 | 88.5 | 754 | 29.0 | 9 | 1.58 | 3.88 | -8.00 | 11.17 | 0.9842 | |
| 12 | 164 | 47.1 | 60.8 | 497 | 30.0 | 7 | -1.55 | 3.83 | -11.02 | 7.92 | 0.9846 | |
| Serum creatinine (mg/dL) | 0 | 227 | 0.719 | 0.208 | 1.970 | 0.69 | 0.33 | - | - | - | - | - |
| 3 | 193 | 0.753 | 0.283 | 3.23 | 0.730 | 0.31 | 0.023 | 0.007 | 0.006 | 0.041 | 0.0052* | |
| 6 | 184 | 0.747 | 0.211 | 1.83 | 0.720 | 0.40 | 0.025 | 0.007 | 0.009 | 0.042 | 0.0008* | |
| 9 | 161 | 0.738 | 0.228 | 2.10 | 0.720 | 0.33 | 0.025 | 0.007 | 0.009 | 0.042 | 0.0005* | |
| 12 | 186 | 0.759 | 0.207 | 1.99 | 0.730 | 0.34 | 0.031 | 0.006 | 0.015 | 0.047 | < 0.0001* | |
| eGFR (mL/min/1.73 m2) | 0 | 224 | 79.94 | 20.22 | 150.3 | 78.67 | 23.5 | - | - | - | - | - |
| 3 | 192 | 77.79 | 22.5 | 220.1 | 76.09 | 15.6 | -2.16 | 0.87 | -4.28 | -0.03 | 0.0451* | |
| 6 | 181 | 76.48 | 18.66 | 129.4 | 74.24 | 29.2 | -3.06 | 0.76 | -4.92 | -1.20 | 0.0003* | |
| 9 | 160 | 78.96 | 19.89 | 159.7 | 78.60 | 25.1 | -2.16 | 0.80 | -4.12 | -0.19 | 0.0263* | |
| 12 | 183 | 75.78 | 18.95 | 155.5 | 74.16 | 26.7 | -3.50 | 0.77 | -5.41 | -1.60 | < 0.0001* | |
| Item | Time after starting alogliptin (months) | Measured values | Changes of measured values | |||||||||
|---|---|---|---|---|---|---|---|---|---|---|---|---|
| N | Mean | SD | Median | Maximum | Minimum | Point estimate | SE | 95% confidence interval | P value‡ | |||
| Lower limit | Upper limit | |||||||||||
| ‡Linear mixed-effects models (covariance structure = unstructured) were used and multiplicity was adjusted by the Dunnett-Hsu method. *P < 0.050. HDL: high-density lipoprotein; LDL: low-density lipoprotein; SD: standard deviation; SE: standard error. | ||||||||||||
| Total cholesterol (mg/dL) | 0 | 163 | 193.2 | 33.6 | 301 | 191.0 | 127 | - | - | - | - | - |
| 3 | 143 | 188.6 | 31.7 | 326 | 186.0 | 113 | -3.90 | 2.28 | -9.49 | 1.69 | 0.2498 | |
| 6 | 127 | 186.8 | 31.2 | 283 | 186.0 | 114 | -5.98 | 2.81 | -12.88 | 0.92 | 0.1082 | |
| 9 | 108 | 182.8 | 30.5 | 252 | 182.5 | 105 | -10.86 | 2.58 | -17.20 | -4.52 | 0.0002* | |
| 12 | 119 | 187.1 | 31.9 | 289 | 186.0 | 104 | -6.84 | 2.48 | -12.93 | -0.74 | 0.0227* | |
| LDL cholesterol (mg/dL) | 0 | 211 | 112.91 | 28.85 | 208.0 | 113.00 | 50 | - | - | - | - | - |
| 3 | 174 | 109.13 | 26.88 | 198.0 | 108.00 | 47 | -2.93 | 1.77 | -7.26 | 1.40 | 0.2716 | |
| 6 | 165 | 107.62 | 27.95 | 198.0 | 110.00 | 56 | -5.56 | 1.91 | -10.21 | -0.91 | 0.0136* | |
| 9 | 135 | 104.84 | 24.95 | 163.0 | 104.00 | 48 | -8.76 | 2.03 | -13.70 | -3.82 | < 0.0001* | |
| 12 | 159 | 107.04 | 24.97 | 186.0 | 107.00 | 57 | -7.22 | 1.95 | -11.99 | -2.46 | 0.0010* | |
| HDL cholesterol (mg/dL) | 0 | 234 | 54.60 | 13.15 | 96.0 | 53.00 | 29 | - | - | - | - | - |
| 3 | 199 | 54.34 | 13.52 | 100.0 | 52.00 | 27 | 0.20 | 0.49 | -0.99 | 1.40 | 0.9826 | |
| 6 | 183 | 54.73 | 13.26 | 96.0 | 53.00 | 26 | 0.45 | 0.56 | -0.93 | 1.84 | 0.8432 | |
| 9 | 159 | 54.31 | 14.26 | 98.0 | 52.00 | 26 | 0.06 | 0.61 | -1.43 | 1.56 | 0.9999 | |
| 12 | 182 | 54.90 | 13.16 | 96.0 | 53.00 | 31 | 0.46 | 0.57 | -0.94 | 1.87 | 0.8413 | |
| Triglycerides (mg/dL) | 0 | 244 | 165.3 | 144.1 | 1520 | 136.5 | 34 | - | - | - | - | - |
| 3 | 211 | 157.4 | 172.1 | 2190 | 124.0 | 32 | -4.61 | 10.07 | -29.23 | 20.00 | 0.9693 | |
| 6 | 195 | 152.2 | 109.4 | 951 | 127.0 | 28 | -15.25 | 7.45 | -33.46 | 2.97 | 0.1288 | |
| 9 | 171 | 147.0 | 87.9 | 619 | 124.0 | 27 | -20.17 | 7.01 | -37.31 | -3.03 | 0.0151* | |
| 12 | 194 | 144.2 | 79.3 | 528 | 125.0 | 35 | -16.50 | 7.20 | -34.10 | 1.09 | 0.0730 | |
| Serum amylase (IU/L) | 0 | 58 | 66.5 | 24.9 | 121 | 60.0 | 31 | - | - | - | - | - |
| 3 | 47 | 72.7 | 23.7 | 119 | 70.0 | 33 | - | - | - | - | - | |
| 6 | 36 | 74.5 | 23.8 | 121 | 72.5 | 24 | - | - | - | - | - | |
| 9 | 11 | 72.6 | 16.0 | 106 | 72.0 | 51 | - | - | - | - | - | |
| 12 | 22 | 71.9 | 27.2 | 131 | 70.0 | 33 | - | - | - | - | - | |