Journal of Clinical Medicine Research, ISSN 1918-3003 print, 1918-3011 online, Open Access
Article copyright, the authors; Journal compilation copyright, J Clin Med Res and Elmer Press Inc
Journal website http://www.jocmr.org

Original Article

Volume 8, Number 2, February 2016, pages 116-125


Efficacy and Safety of Ipragliflozin in Japanese Patients With Type 2 Diabetes: Interim Outcome of the ASSIGN-K Study

Figure

Figure 1.
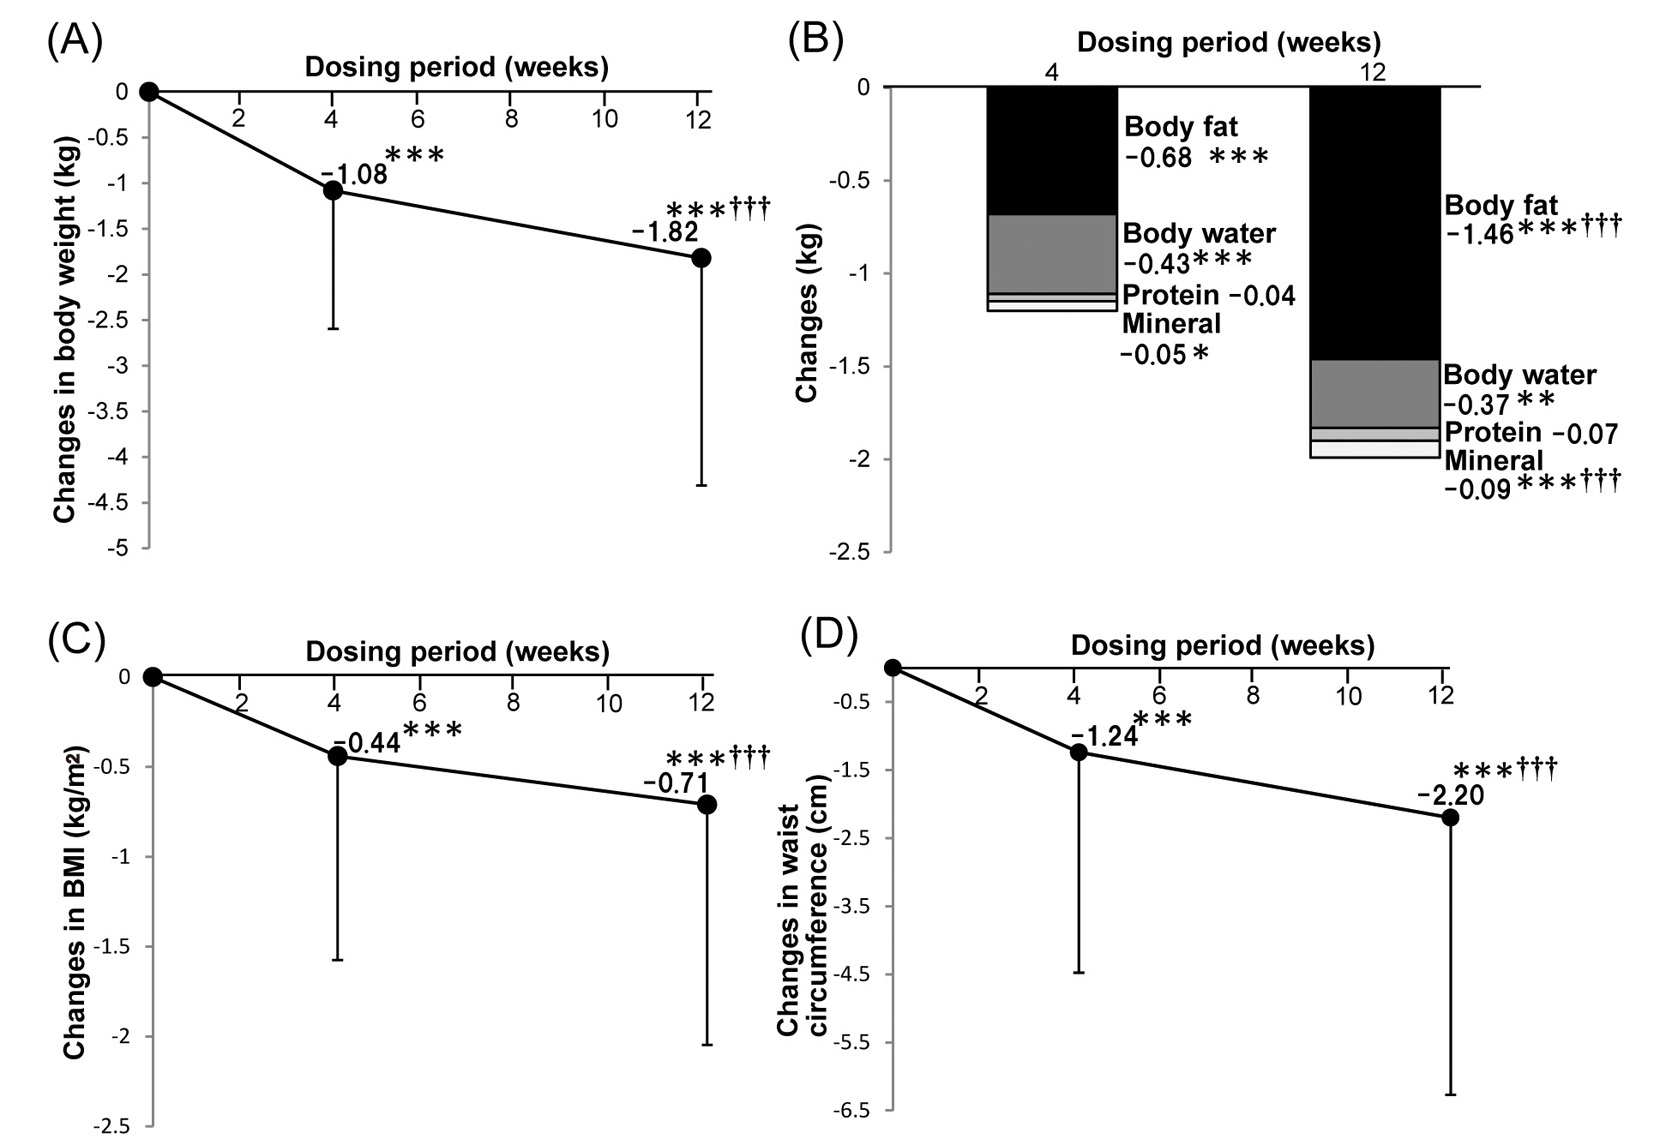
Figure 1. Effects of ipragliflozin therapy on body composition. Changes of body weight after ipragliflozin treatment (n = 240) (A). Changes of body composition parameters after ipragliflozin treatment (n = 239) (B). Changes of body mass index after ipragliflozin treatment (n = 241) (C). Changes of waist circumference after ipragliflozin treatment (n = 250) (D). Data are shown as the mean ± standard deviation. Significant differences after 4 and 12 weeks of treatment compared with baseline: ***P < 0.001, **P < 0.01, *P < 0.05. Significant differences between 4 and 12 weeks of treatment: †††P < 0.001, ††P < 0.01, †P < 0.05.

Tables

Table 1. Profile of the Patients
 
n%Mean ± standard deviation
Sex
  Male123 (47.9)
  Female134 (52.1)
Age, years25753.9 ± 10.4
Body weight, kg25780.29 ± 17.43
Body mass index, kg/m225729.97 ± 5.39
Waist circumference, cm253101.19 ± 11.75
Duration of diabetes2579.6 ± 6.9
Hemoglobin A1c, %2578.23 ± 1.48
Fasting blood glucose , mg/dL110158.5 ± 43.6
Postprandial blood glucose, mg/dL93199.1 ± 85.2
Concomitant medications
  Dipeptidyl peptidase-4 inhibitor154 (77.0)
  Biguanide144 (72.0)
  Sulfonylurea95 (47.5)
  Insulin47 (23.5)
  Thiazolidinedione45 (22.5)
  α-glucosidase inhibitor26 (13.0)
  Glinide11 (5.5)


Table 2. Summary of the Changes in Glycemic Control
 
nBaseline4 weeks12 weeks
ANOVA vs. 0 weeks, ***P < 0.001, **P < 0.01, *P < 0.05; 4 weeks vs. 12 weeks, †††P < 0.001, ††P < 0.01, †P < 0.05. CI: confidence interval; HOMA: homeostatic model assessment.
Fasting blood glucose level, mg/dL110158 ± 43.6139.2 ± 37.1***134.6 ± 34.6***
  vs. baseline-19.3 ± 37.8-23.9 ± 35.2
  95% CI-26.4, -12.2-30.5, -17.2
Postprandial blood glucose level, mg/dL93199.1 ± 1.49161.0 ± 60.0***54.9 ± 60.5***
  vs. baseline-38.1 ± 84.3-44.2 ± 77.0
  95% CI-55.5, -20.8-60.1, -28.4
Hemoglobin A1c, %2578.23 ± 1.497.81 ± 1.24***7.55 ± 1.28***†††
  vs. baseline-0.43 ± 0.64-0.68 ± 1.23
  95% CI-0.51, -0.35-0.83, -0.53
HOMA-R554.62 ± 3.683.35 ± 2.43**3.36 ± 2.45***
  vs. baseline-1.27 ± 2.73-1.26 ± 1.93
  95% CI-2.01, -0.53-1.78, -0.73
HOMA-β5546.2 ± 43.761.0 ± 87.354.9 ± 45.6*
  vs. baseline14.7 ± 83.78.6 ± 26.0
  95% CI-7.9, -37.41.6, 15.7
Insulin, μU/mL7312.79 ± 8.9011.79 ± 9.3213.89 ± 20.64
  vs. baseline-1.00 ± 7.421.10 ± 16.46
  95% CI-2.73, -0.74-2.74, 4.94


Table 3. Summary of the Changes of Blood Pressure and Fasting Serum Lipids
 
nBaseline4 weeks12 weeks
ANOVA vs. 0 weeks, ***P < 0.001, **P < 0.01, *P < 0.05; 4 weeks vs. 12 weeks, †††P < 0.001, ††P < 0.01, †P < 0.05. CI: confidence interval; LDL: low-density lipoprotein; HDL: high-density lipoprotein.
Systolic blood pressure, mm Hg254131.3 ± 15.9126.9 ± 15.9***127.3 ± 15.6***
  vs. baseline-4.3 ± 14.1-4.0 ± 14.6
  95% CI-6.1, -2.6-5.8, -2.2
Diastolic blood pressure, mm Hg25478.3 ± 10.676.4 ± 10.2**76.3 ± 11.0**
  vs. baseline-1.9 ± 9.4-2.1 ± 10.3
  95% CI-3.1, -0.8-3.3, -0.8
Free fatty acids, μEq/L218630.7 ± 303.9664 ± 308.0624.3 ± 338.0
  vs. baseline33.3 ± 325.6-6.5 ± 360.3
  95% CI-10.2, 76.8-54.6, 41.6
Triglycerides, mg/dL254203.0 ± 164.9182.7 ± 113.8180.8 ± 129.1*
  vs. baseline-20.3 ± 141.2-22.3 ± 149.1
  95% CI-37.8, -2.9-40.7, -3.8
LDL cholesterol, mg/dL208114.2 ± 32.7111.5 ± 34.0112.5 ± 31.1
  vs. baseline-2.8 ± 24.6-1.7 ± 25.2
  95% CI-6.1, 0.6-5.2, 1.7
HDL cholesterol, mg/dL25250.6 ± 13.150.9 ± 13.453.3 ± 16.1**††
  vs. baseline0.3 ± 8.72.7 ± 12.9
  95% CI-0.8, 1.41.1, 4.3
Total cholesterol, mg/dL243201.8 ± 40.2196.9 ± 38.9*200.3 ± 37.9
  vs. baseline-4.9 ± 28.3-1.5 ± 29.6
  95% CI-8.4, -1.3-5.3, 2.2
Non-HDL cholesterol, mg/dL241151.1 ± 40.9146.2 ± 40.7*147.0 ± 38.6
  vs. baseline-4.9 ± 28.0-4.1 ± 30.8
  95% CI-8.4, -1.3-8.0, -0.2


Table 4. Summary of the Changes in Laboratory Values
 
nBaseline4 weeks12 weeks
ANOVA vs. 0 weeks, ***P < 0.001, **P < 0.01, *P < 0.05; 4 weeks vs. 12 weeks; †††P < 0.001, ††P < 0.01, †P < 0.05. CI: confidence interval; ALP: alkaline phosphatase; ALT: alanine aminotransferase; AST: aspartate transaminase; γ-GTP: gamma-glutamyl transpeptidase; LDH: lactate dehydrogenase; BUN: blood urea nitrogen.
ALP, IU/L246239.9 ± 88.1228.3 ± 75.5***230.1 ± 72.4**
  vs. baseline-11.7 ± 42.9-9.9 ± 47.5
  95% CI-17.0, -6.3-15.8, -3.9
ALT, IU/L25142.9 ± 32.439.6 ± 31.8*35.1 ± 24.0***†††
  vs. baseline-3.3 ± 18.6-7.7 ± 24.1
  95% CI-5.6, -0.9-10.7, -4.8
AST, IU/L25235.3 ± 27.833.1 ± 26.5*29.1 ± 18.1***†††
  vs. baseline-2.2 ± 12.1-6.2 ± 18.7
  95% CI-3.7, -0.7-8.5, -3.9
γ-GTP, IU/L25165.6 ± 74.853.9 ± 61.4***47.7 ± 48.6***†
  vs. baseline-11.7 ± 32.5-17.9 ± 54.8
  95% CI-15.7, -7.6-24.7, -11.1
LDH, IU/L242203.9 ± 43.4196.6 ± 39.6***194.1 ± 38.3***
  vs. baseline-7.3 ± 29.9-9.9 ± 36.8
  95% CI-11.1, -3.5-14.5, -5.2
BUN, mg/dL25014.1 ± 4.414.7 ± 4.4*15.1 ± 4.3***
  vs. baseline0.6 ± 3.31.0 ± 3.6
  95% CI0.2, 1.00.6, 1.5
Uric acid, mg/dL2455.6 ± 1.65.2 ± 1.9***5.0 ± 1.3***
  vs. baseline-0.4 ± 1.7-0.6 ± 1.5
  95% CI-0.6, -0.2-0.7, -0.4
Serum creatinine, mg/dL2500.70 ± 0.190.73 ± 0.20***0.71 ± 0.21†
  vs. baseline0.02 ± 0.080.01 ± 0.10
  95% CI0.01, 0.03-0.01, 0.02
Na+, mEq/L247140.6 ± 2.4141.0 ± 2.2*140.8 ± 2.1
  vs. baseline0.3 ± 2.10.2 ± 2.3
  95% CI0.1, 0.6-0.1, 0.4
K+, mEq/L2454.1 ± 0.54.1 ± 0.54.3 ± 0.5***†††
  vs. baseline0.1 ± 0.40.2 ± 0.5
  95% CI0.0, 0.10.2, 0.3
Cl-, mEq/L245102.4 ± 3.1102.9 ± 3.0**102.7 ± 2.7
  vs. baseline0.5 ± 2.40.2 ± 2.5
  95% CI0.2, 0.8-0.1, 0.6
P, mg/dL2343.3 ± 0.63.5 ± 0.6***3.4 ± 0.5*
  vs. baseline0.1 ± 0.50.1 ± 0.5
  95% CI0.1, 0.20.0, 0.2
Blood ketone bodies, mmol/L1970.28 ± 0.460.32 ± 0.480.28 ± 0.35
  vs. baseline0.05 ± 0.410.01 ± 0.56
  95% CI-0.01, 0.10-0.07, 0.09
Hematocrit, %24943.1 ± 4.244.0 ± 5.1***45.0 ± 4.6***†††
  vs. baseline0.9 ± 3.31.9 ± 3.4
  95% CI0.5, 1.31.5, 2.3


Table 5. Summary of Adverse Events
 
Number of subjectsIncidence (%)
†Serious adverse events.
All adverse events6822.6
Adverse events resulting in discontinuation of treatment217.0
Adverse reactions3411.3
Adverse events resulting in hospitalization31.0
Serious adverse events31.0
Deaths00
Main adverse events
  Vulvovaginal candidiasis82.7
  Cystitis62.0
  Influenza62.0
  Genital pruritus51.7
  Upper respiratory tract infection51.7
  Eczema41.3
  Nasopharyngitis41.3
  Nausea31.0
  Drug eruption31.0
  Constipation31.0
  Hypoglycemia20.7
  Ketosis†10.3
  Urinary tract infection†10.3
  Unstable angina†10.3
  Dehydration10.3
  Vulvovaginal discomfort10.3