Figures
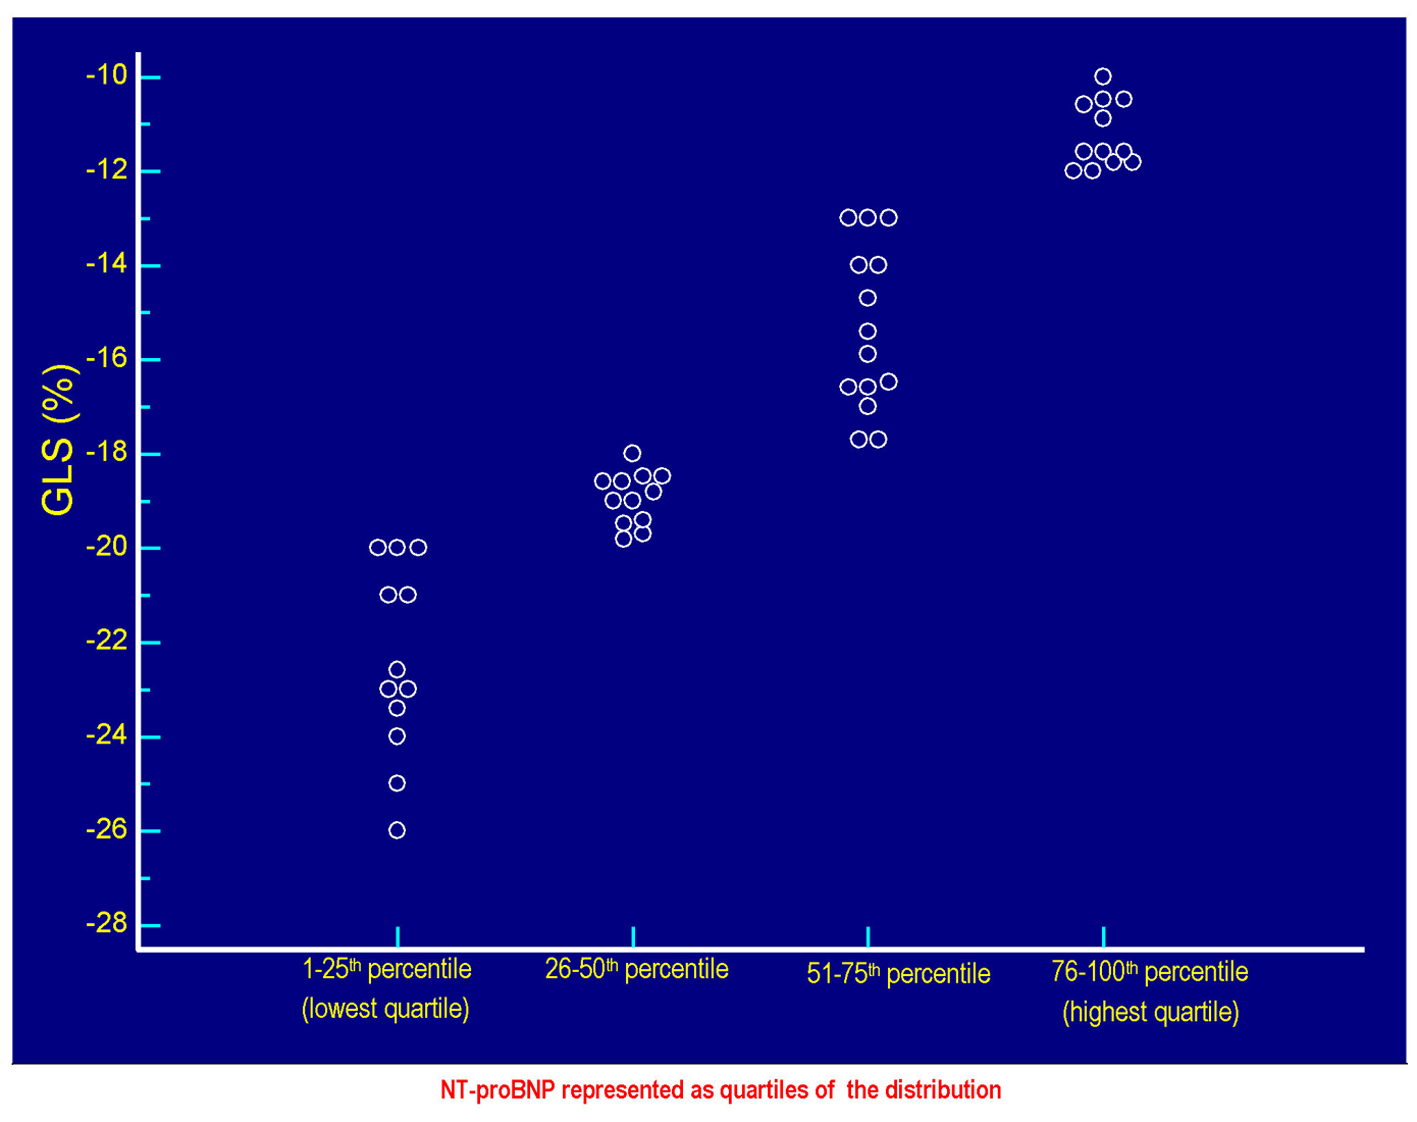
Figure 1. The values of GLS (%) of each patient are plotted against the respective values of serum NT-proBNP. Each circlet, corresponding to a given value of GLS, falls in one of the four groups of circlets coincident with the quartiles of NT-proBNP derived from the categorization of the entire range of possible NT-proBNP values in the context of the 50 patients included in the study. The lowest quartile includes the NT-proBNP values ≤ 58 pg/mL, the quartile between the 26th percentile and the median (50th percentile) includes values > 58 and ≤ 299.5 pg/mL, the quartile between 51th and the 75th percentile includes the values > 299.5 and ≤ 1,405 pg/mL, the highest quartile incorporates the values > 1,405 pg/mL up to the highest value found, i.e., 4,123 pg/mL. Note that the less pronounced cases of global longitudinal systolic deformation are grouped in the highest quartile of the distribution of the values of NT-proBNP, while the most efficient cases of GLS (characterized by the most negative values) are grouped in the lowest quartile of NT-proBNP. Please note also that the increasing (i.e., progressively less negative) values of GLS are coupled with progressively increasing values of NT-proBNP, according to a direct linear relationship (Fig. 2). GLS: global longitudinal strain; NT-proBNP: N-terminal fragment of the prohormone of the B-type natriuretic peptide.
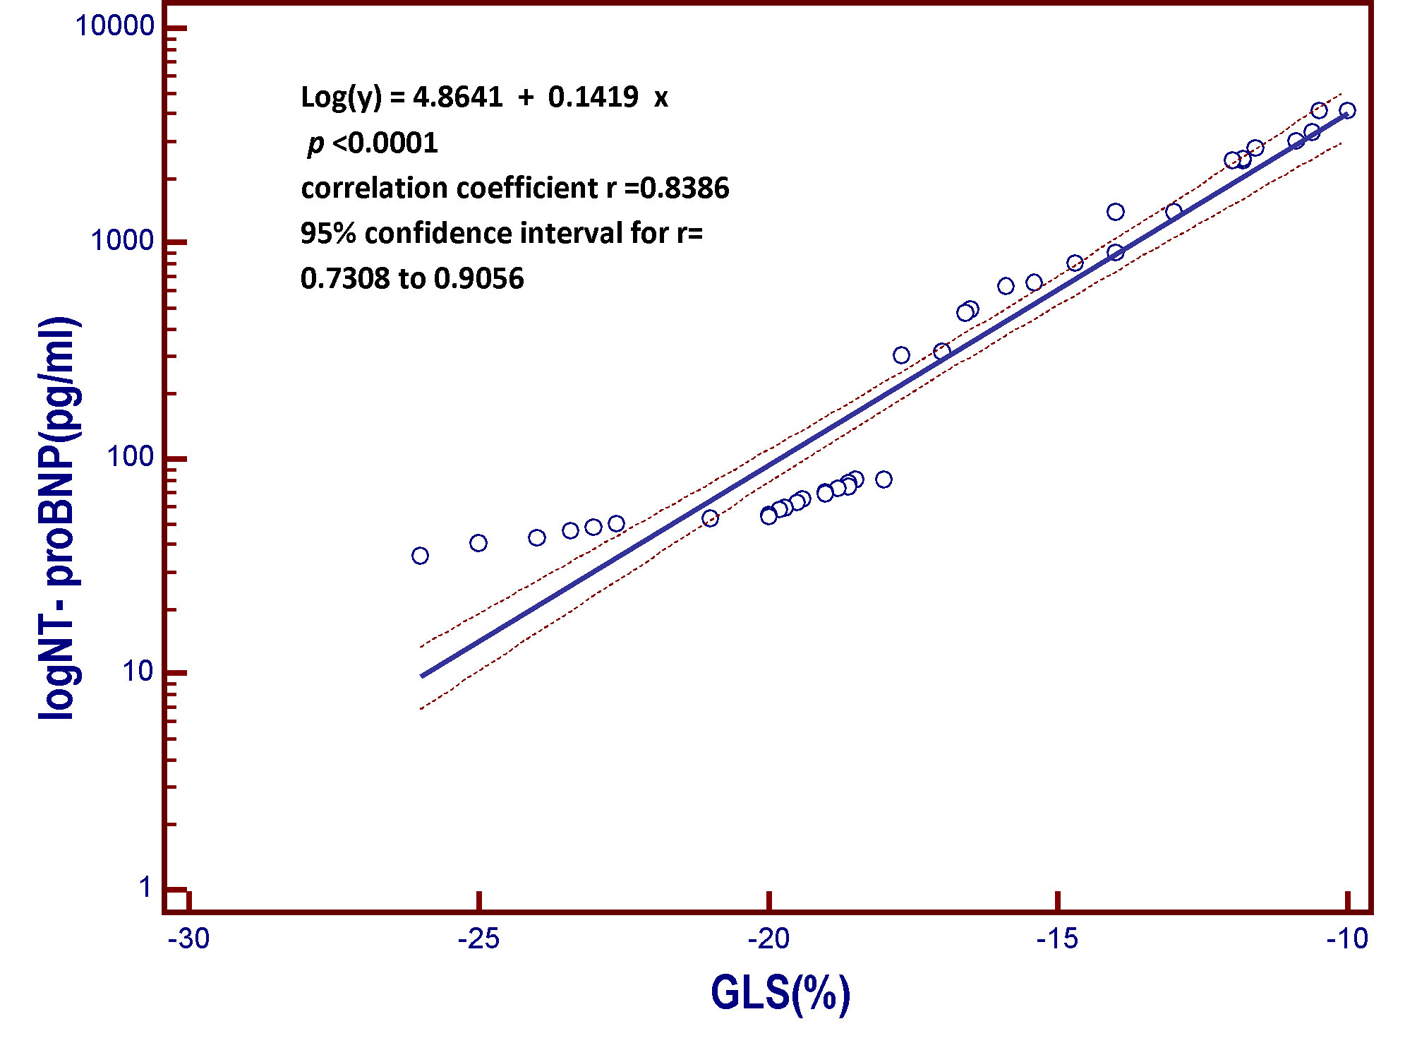
Figure 2. Linear regression model derived from the patient population of the present study. The model includes the B-type natriuretic peptide (log NT-proBNP), which is the dependent variable y, on the vertical axis, and the global longitudinal strain (GLS) on the horizontal axis. As the global longitudinal systolic deformation of the left ventricular chamber is reduced, the value of the NT-proBNP, a marker of myocardial left ventricular intracavitary tension, progressively increases. In other words, those who have the less negative values of global systolic longitudinal strain, that is, who have weaker systolic shortening of the left ventricular chamber due to less valid longitudinal contraction of the subendocardial fibers, are also those having the highest circulating levels of B-type natriuretic peptide. More impaired is the longitudinal contractile function, the higher the value of the serum natriuretic peptide. GLS: global longitudinal strain; NT-proBNP: N-terminal fragment of the pro B-type natriuretic peptide; pg: picograms; log: logarithmic transformation of Y.
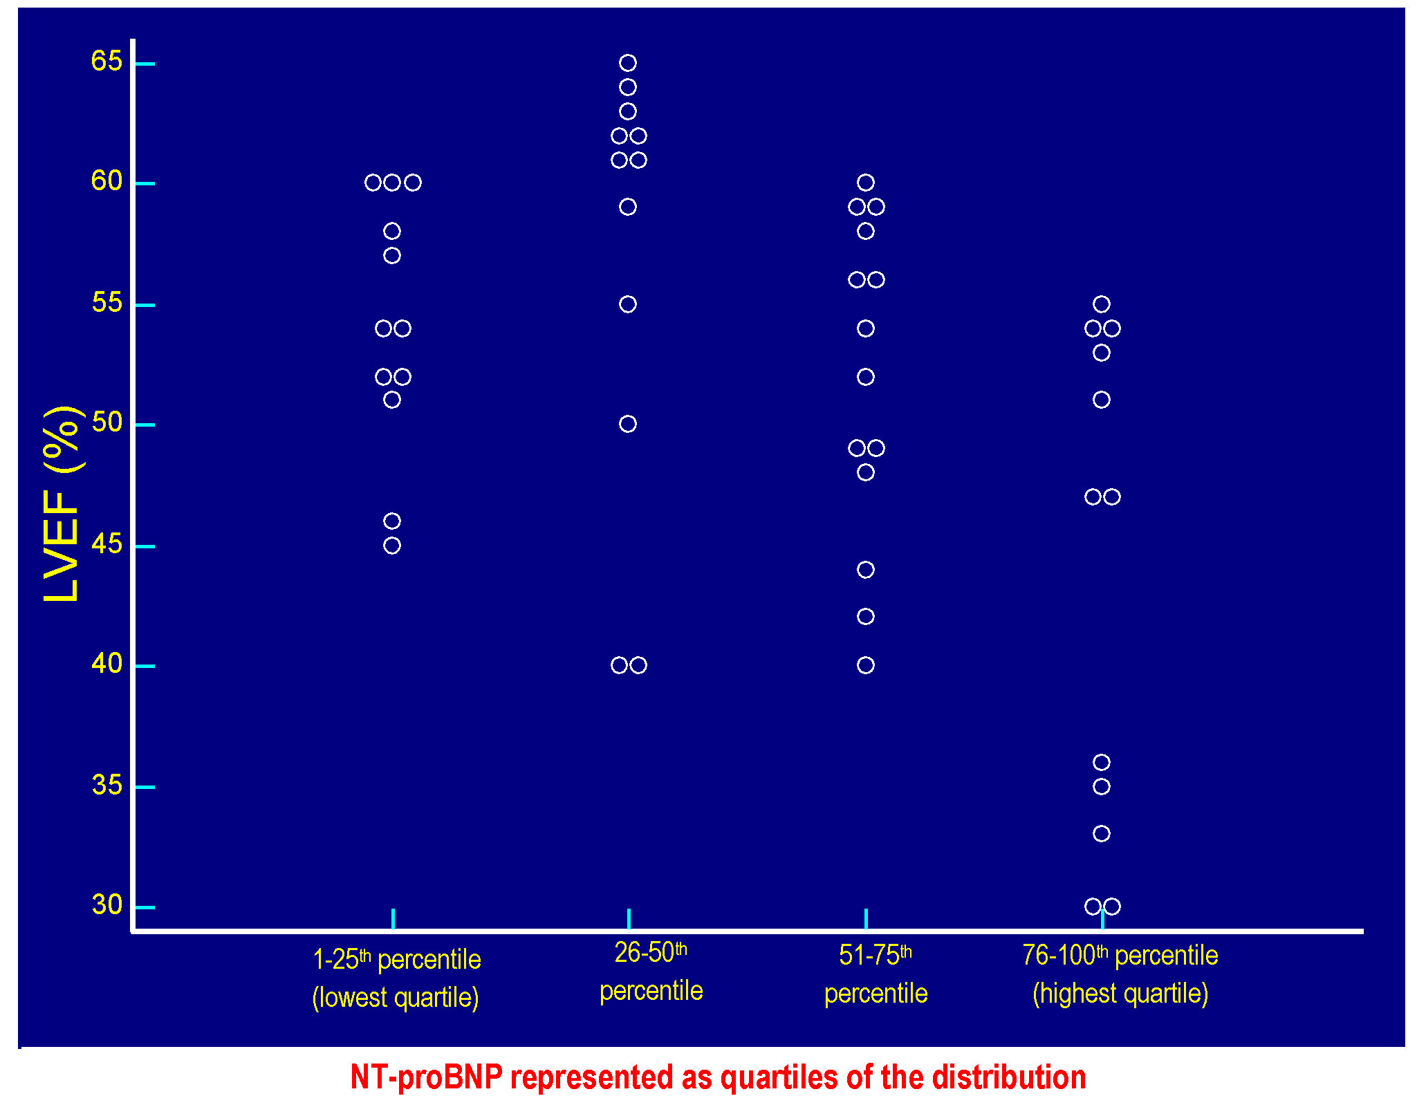
Figure 3. The values of LVEF (%) of each patient are plotted against the respective values of serum NT-proBNP. Each circlet, corresponding to a given value of LVEF, falls in one of the four groups of circlets coincident with the quartiles of NT-proBNP derived from the categorization of the entire range of possible NT-proBNP values in the context of the 50 patients included in the study. The lowest quartile includes the NT-proBNP values ≤ 58 pg/mL, the quartile between the 26th percentile and the median (50th percentile) includes values > 58 and ≤ 299.5 pg/mL, the quartile between 51th and the 75th percentile includes the values > 299.5 and ≤ 1,405 pg/mL, the highest quartile incorporates the values > 1,405 pg/mL up to the highest value found, i.e., 4,123 pg/mL. Please note that the values of LVEF are distributed within the whole range of the possible NT-proBNP values, so it is not possible to identify the existence of a significant inverse linear relationship between LVEF and serum NT-proBNP in the study population (Fig. 4). LVEF: left ventricular ejection fraction; NT-proBNP: N-terminal fragment of the prohormone of the B-type natriuretic peptide.
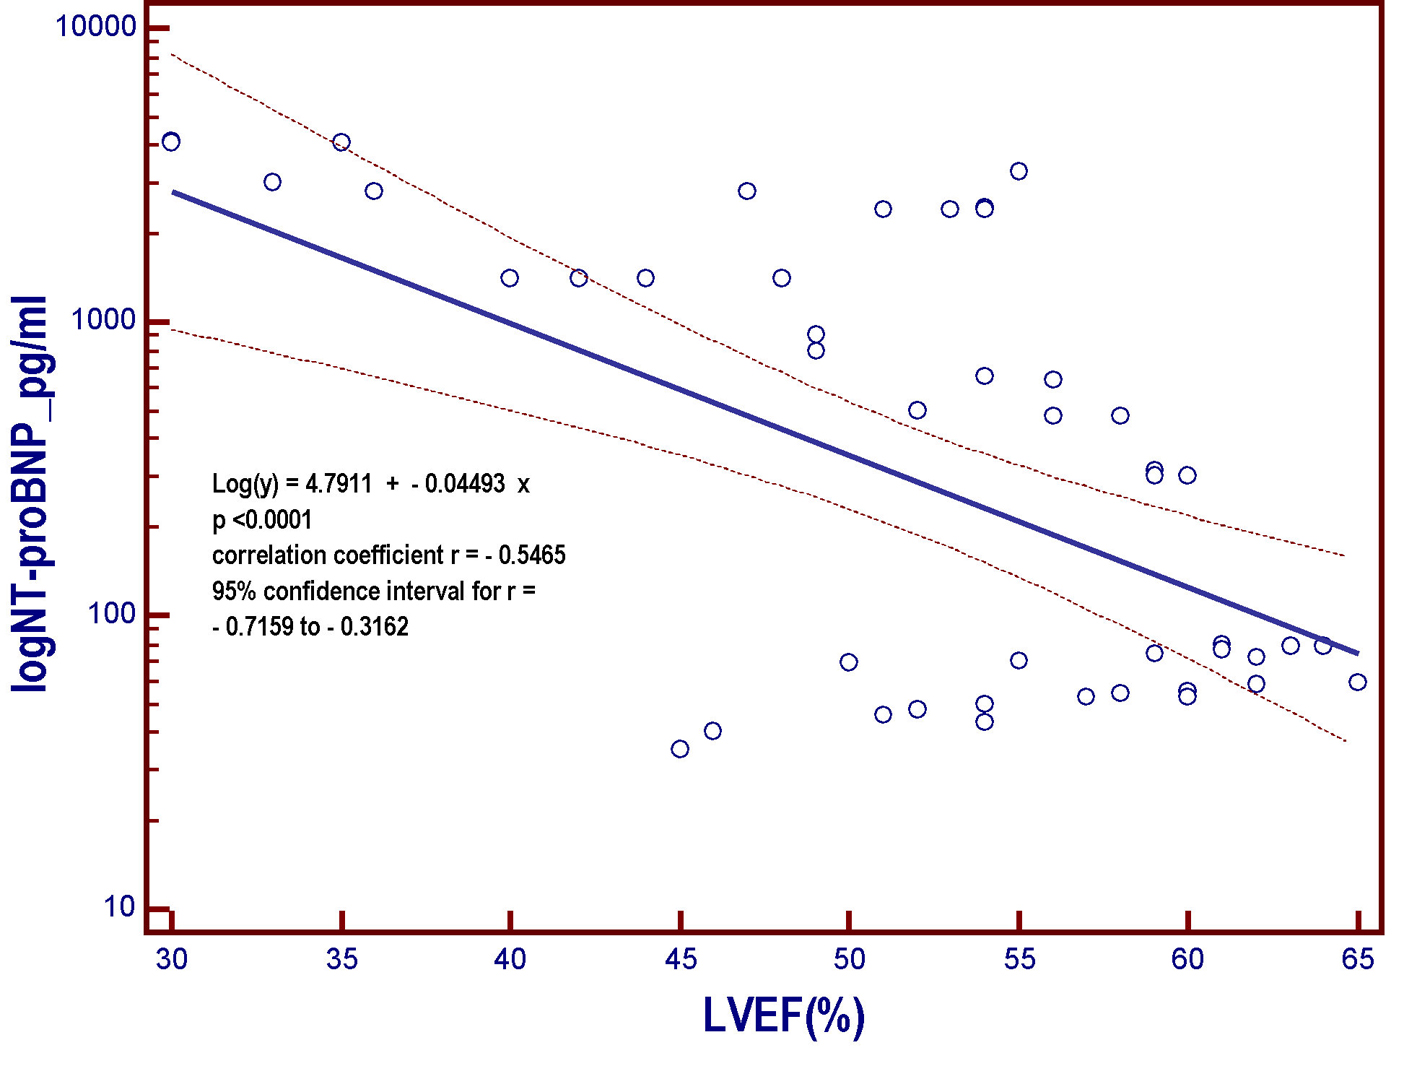
Figure 4. Linear regression model derived from the patient population of the present study. The model includes the NT-proBNP that undergoes logarithmic transformation (log NT-proBNP), assumed as the dependent variable y and placed on the vertical axis, and the left ventricular ejection fraction (LVEF), put on the horizontal axis. As the LVEF progressively decreases across the whole range of the possible values that it can assume within the entire patient population, the value of the NT-proBNP, a marker of myocardial left ventricular intracavitary tension, progressively increases. However, the strength of the relationship is much less marked (r = -0.5465) with respect to that characterizing the relation between log NT-proBNP and GLS (r = 0.8386; Fig. 2). NT-proBNP: N-terminal fragment of the pro B-type natriuretic peptide; pg: picograms; LVEF: left ventricular ejection fraction; log: logarithmic transformation of Y; GLS: global longitudinal strain.
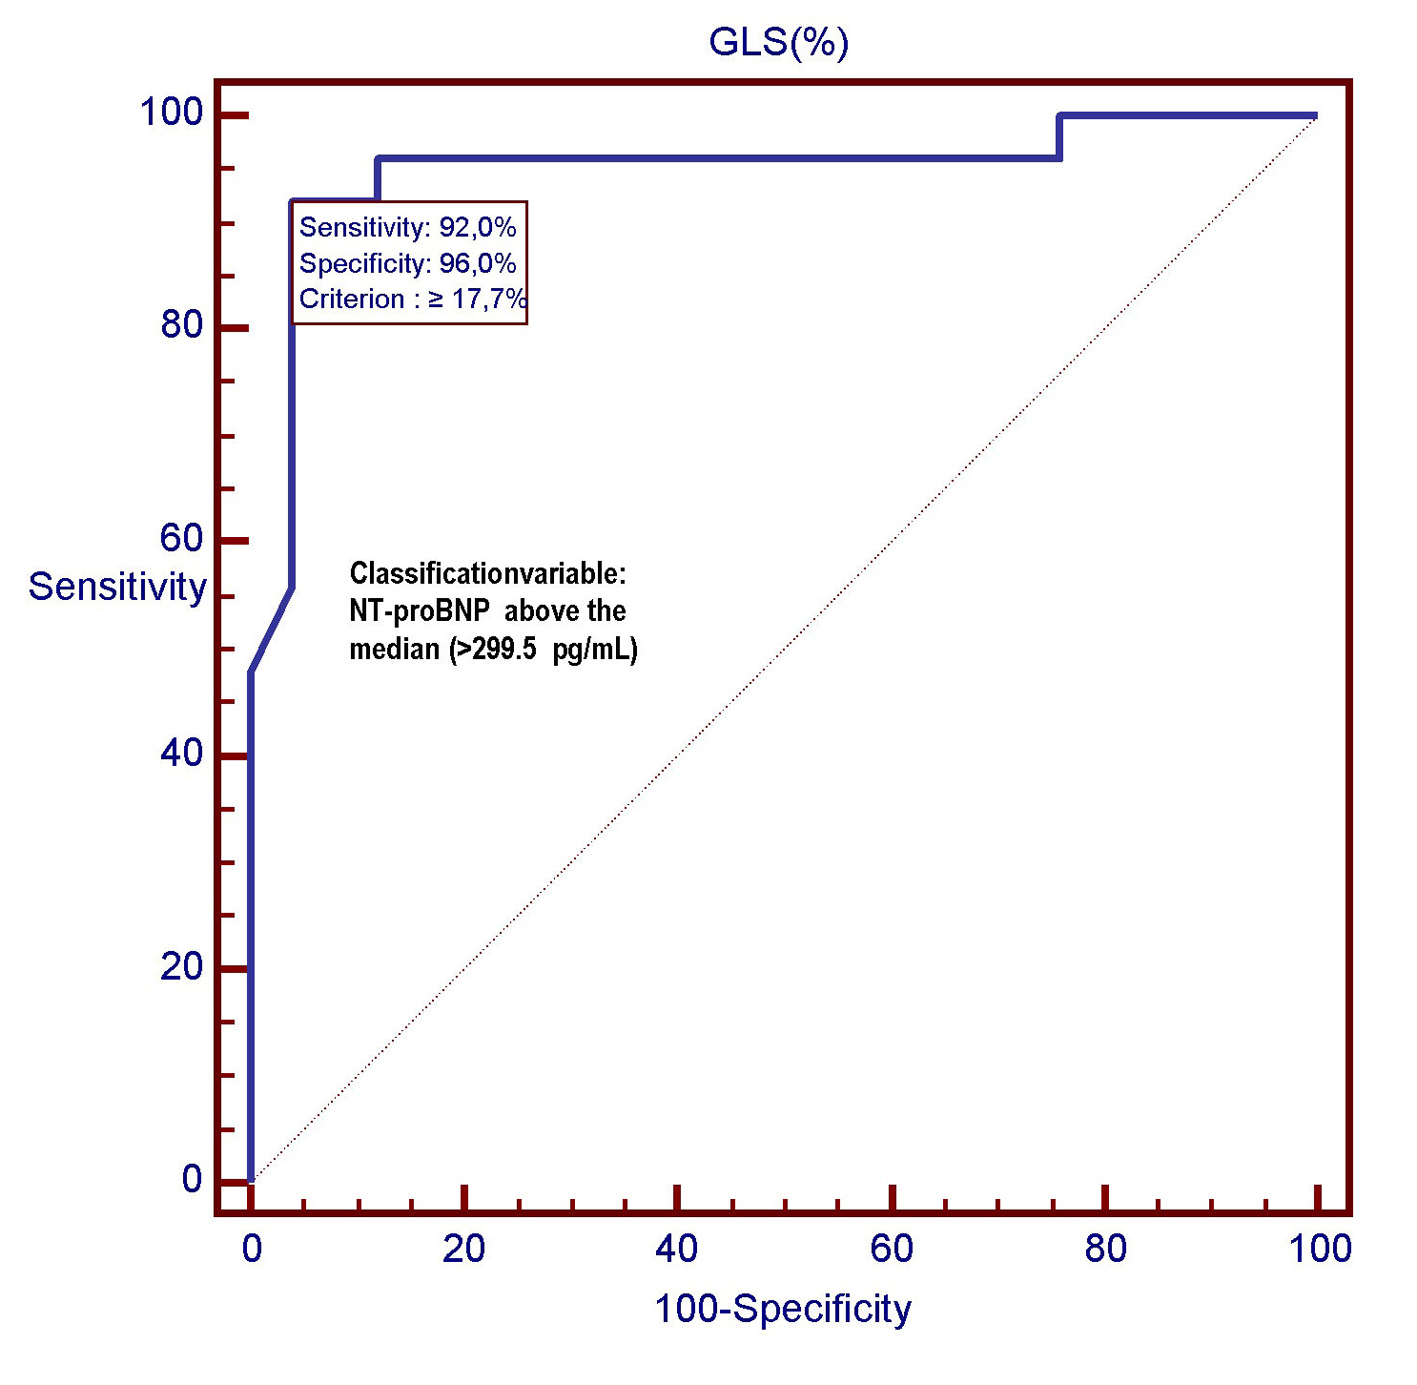
Figure 5. In this ROC plot, there is the representation of the diagnostic performance (AUC = 0.949) of GLS as a predictor of relatively high values (> 299.5 pg/mL) of NT-proBNP among 50 CHF patients. GLS: global longitudinal strain; ROC: receiver operating characteristic; NT-proBNP: N-terminal fragment of the pro B-type natriuretic peptide; pg: pictograms.
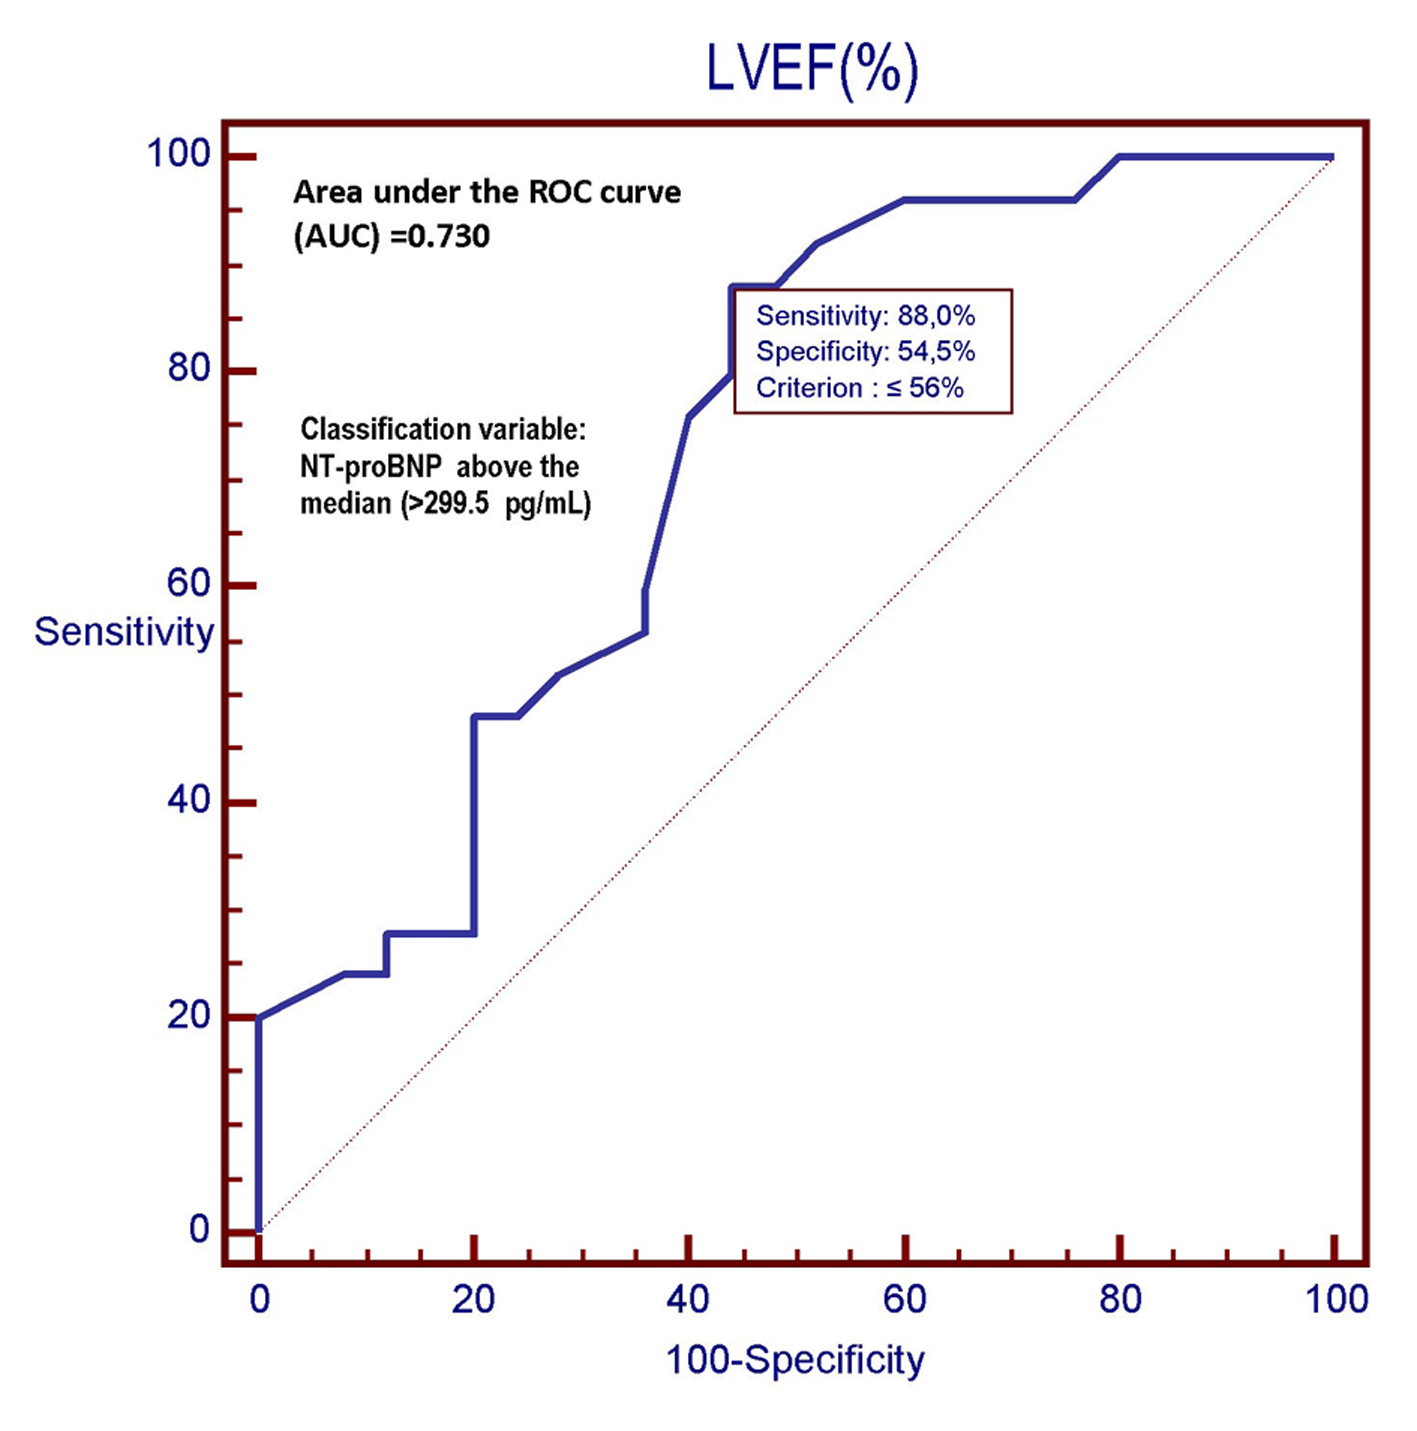
Figure 6. In this ROC plot, there is the representation of the diagnostic performance (AUC = 0.730) of the LVEF as a predictor of relatively high values (> 299.5 pg/mL) of NT-proBNP among 50 CHF patients. LVEF: left ventricular ejection fraction; ROC: receiver operating characteristic; NT-proBNP: N-terminal fragment of the pro B-type natriuretic peptide; pg: picograms.
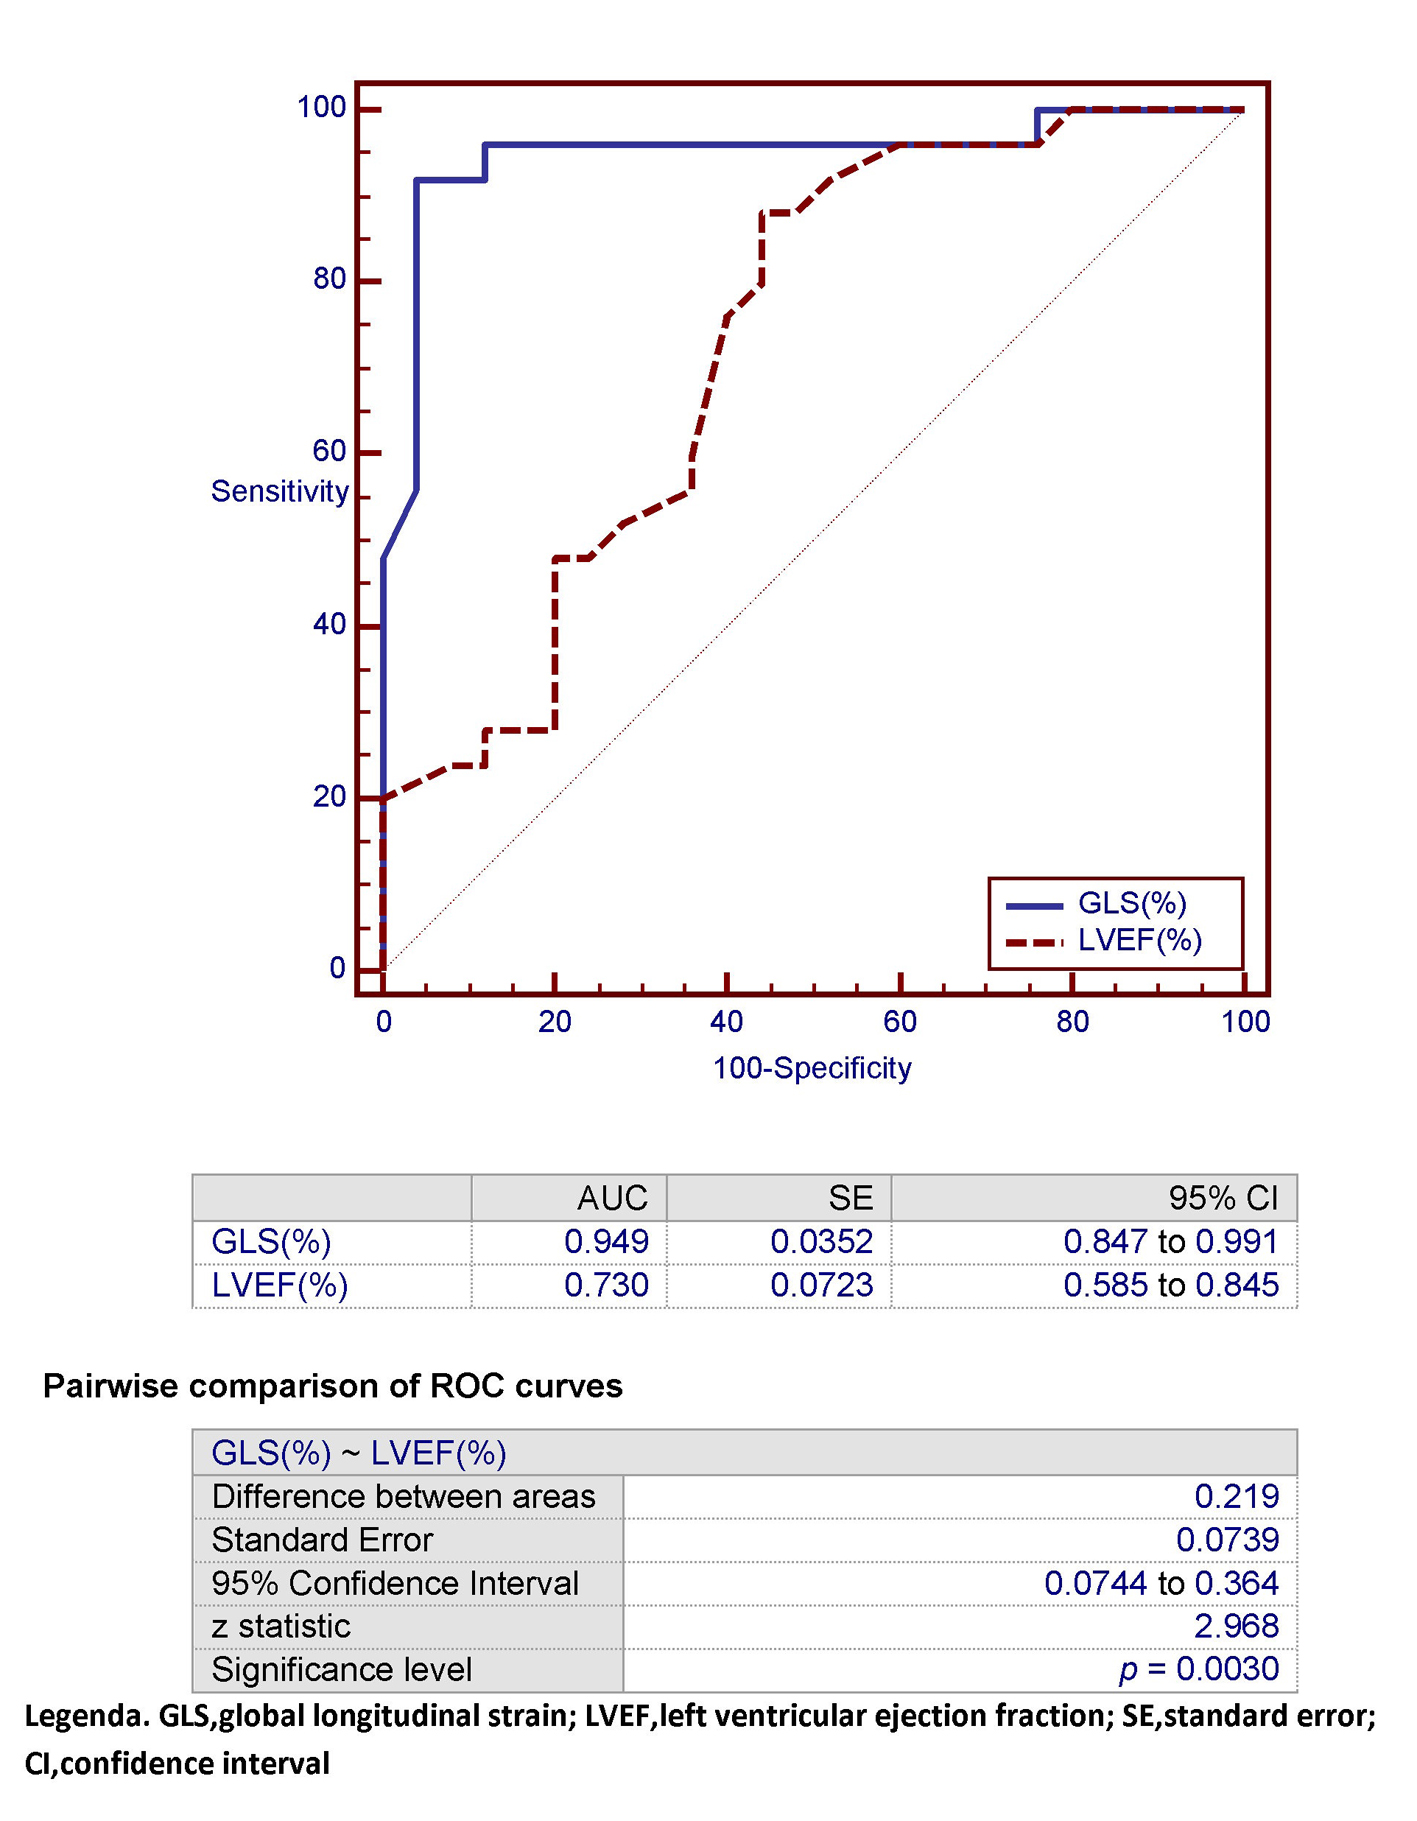
Figure 7. In this ROC plot, the area under the curve (AUC) that characterizes GLS for detection of an NT-proBNP > 299.5 pg/mL (classification variable) is compared with the corresponding AUC exhibited by LVEF within the study population. GLS: global longitudinal strain; LVEF: left ventricular ejection fraction; SE: standard error; CI: confidence interval.
Table
Table 1. The Multiple Linear Regression Analysis Shows That GLS Is the Best Independent Predictor (rpartial = 0.7076) of High Levels of NT-proBNP, Within a Parsimonious Model Including Age, BMI, eGFR, LAVi, and LVEF
| BMI: body mass index; eGFR: estimated glomerular filtration rate; GLS: global longitudinal strain; LAVi: left atrial volume index; LVEF: left ventricular ejection fraction; r: correlation coefficient. |
| Dependent variable y | NT-proBNP (pg/mL) |
| Sample size | 50 |
| Coefficient of determination R2 | 0.8539 |
| R2-adjusted | 0.8335 |
| Multiple correlation coefficient | 0.9240 |
| Residual standard deviation | 521.4549 |
| Regression equation |
| Independent variables | Coefficient | Std. error | rpartial | t | P |
| Constant | 11,132.85 | | | | |
| Age | 4.9594 | 6.4871 | 0.1158 | 0.76 | 0.4487 |
| BMI | 21.0525 | 26.0587 | 0.1223 | 0.80 | 0.4236 |
| eGFR | -1.5465 | 3.5382 | -0.06651 | -0.44 | 0.6642 |
| GLS (%) | 305.0159 | 46.4509 | 0.7076 | 6.56 | < 0.0001 |
| LAVi (mL/m2) | -97.8632 | 47.3994 | -0.3003 | -2.06 | 0.045 |
| LVEF (%) | -54.7913 | 11.4641 | -0.589 | -4.8 | < 0.0001 |
| | | | | |
|
| Analysis of variance |
| F-ratio | 41,873 | | | | |
| Significance level | P < 0.0001 | | | | |