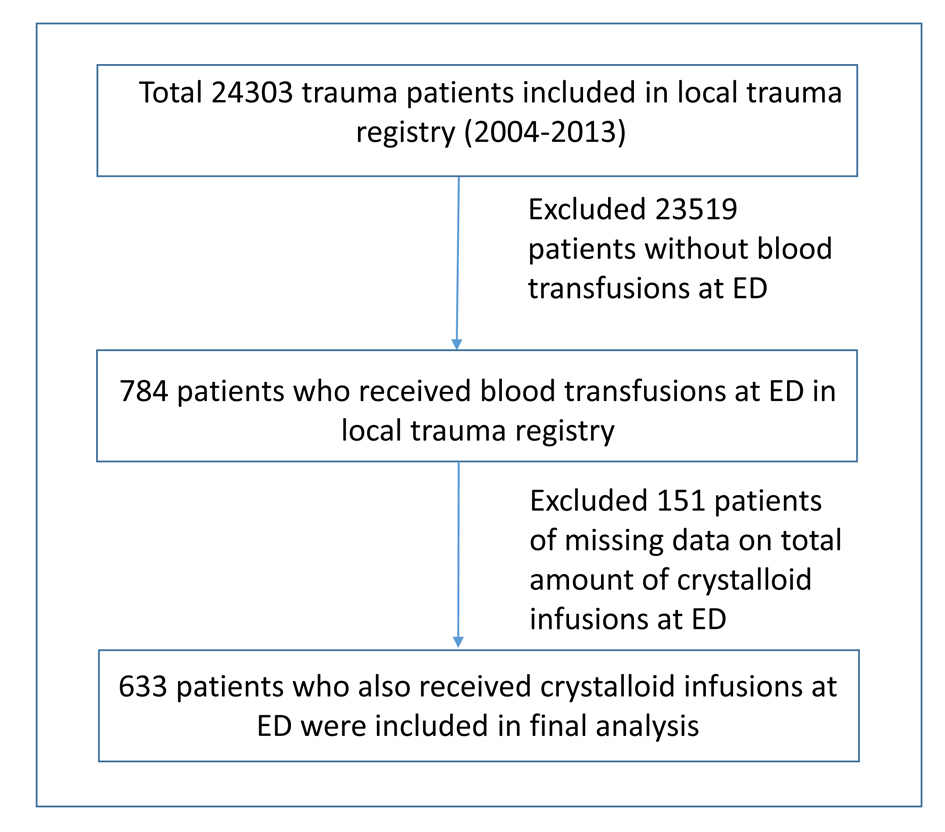
Figure 1. The flow diagram of patients placed in final analysis.
| Journal of Clinical Medicine Research, ISSN 1918-3003 print, 1918-3011 online, Open Access |
| Article copyright, the authors; Journal compilation copyright, J Clin Med Res and Elmer Press Inc |
| Journal website http://www.jocmr.org |
Original Article
Volume 7, Number 12, December 2015, pages 947-955
Benefits of Initial Limited Crystalloid Resuscitation in Severely Injured Trauma Patients at Emergency Department
Figures
Tables
| Patients who received < 2,000 mL crystalloid (N = 210) | Patients who received ≥ 2,000 mL crystalloid (N = 423) | P value | |
|---|---|---|---|
| RTS: revised trauma score; ISS: injury severity score; SBP: systolic blood pressure; GCS: Glasgow coma scale; LOS: length of stay; C/PRBC: crystalloid to packed red blood cell ratio; CI: confidence interval. | |||
| General demographics | |||
| Age (years) | 38.09 ± 16.46 | 41.03 ± 18.19 | 0.05 |
| Gender (male, %) | 80.95% | 77.54% | 0.32 |
| Race (white, %) | 52.38% | 59.57% | 0.26 |
| Mode of arrival (ambulance/helicopter, %) | 92.86% | 95.98% | 0.09 |
| ED clinical variables | |||
| RTS on arrival | 4.66 ± 2.81 | 4.96 ± 2.62 | 0.22 |
| ISS on arrival | 25.5 ± 18.7 | 28.5 ± 17.6 | 0.05 |
| ED SBP (mm Hg, mean ± SD, 95%CI) | 81 ± 48 (74 - 88) | 87 ± 42 (83 - 91) | 0.13 |
| ED HR (bpm, mean ± SD, 95% CI) | 93 ± 48 (87 - 100) | 96 ± 43 (92 - 100) | 0.52 |
| ED RR (times, mean ± SD, 95% CI) | 14 ± 9 (13 - 16) | 15 ± 9 (14 - 16) | 0.66 |
| GCS (mean ± SD) | 8.0 ± 5.4 (7.3 - 8.8) | 8.3 ± 5.4 (7.8 - 8.8) | 0.58 |
| Hgb (mg/dL, mean ± SD) | 11.3 ± 2.5 (10.9 - 11.7) | 11.1 ± 2.4 (10.8 - 11.3) | 0.29 |
| ED total crystal fluid received (mL, mean ± SD) | 1,352 ± 621 (1,267 - 1,437) | 3,870 ± 1,419 (3,734 - 4,006) | < 0.01 |
| ED blood transfusion (units, mean ± SD) | 2.53 ± 1.51 (2.32-2.73) | 3.01 ± 1.97 (2.82 - 3.20) | < 0.01 |
| ED total LOS (h, mean ± SD) | 0.8 ± 1.2 (0.7-1.0) | 1.3 ± 1.8 (1.1 - 1.5) | < 0.01 |
| C/PRBC ratio (ratio, mean ± SD) | 0.71 ± 0.54 | 1.70 ± 1.02 | < 0.01 |
| In-hospital variables | |||
| Mortality (n, %) | 108/210 (51.43%) | 189/423 (44.68%) | 0.11 |
| Early mortality (n, %) | 89/108 (82.41%) | 155/189 (82.01%) | 0.93 |
| ICU LOS (days, mean ± SD, 95% CI)) | 7.0 ± 11.4 (5.5 - 8.6) | 9.2 ± 13.0 (8.0 - 10.5) | 0.04 |
| Hospital LOS (days, mean ± SD, 95% CI) | 9.7 ± 15.4 (7.6 - 11.8) | 12.3 ± 16.4 (10.7 - 13.9) | 0.06 |
| Patients who received < 2,000 mL crystalloid | Patients who received ≥ 2,000 mL crystalloid | P value | |
|---|---|---|---|
| Total trauma patients at ED | 210 | 423 | |
| C/PRBC ratio (ratio, mean ± SD) | 0.71 ± 0.54 | 1.70 ± 1.02 | < 0.01 |
| Mortality (n, %) | 108/210 (51%) | 189/423 (45%) | 0.11 |
| Early mortality (n, %) | 89/108 (82%) | 155/189 (82%) | 0.93 |
| Late mortality (n, %) | 19/108 (16%) | 34/189 (18%) | 0.93 |
| ED total LOS (h, mean ± SD) | 0.8 ± 1.2 (0.7 - 1.0) | 1.3 ± 1.8 (1.1-1.5) | < 0.01 |
| ICU LOS (days, mean ± SD, 95% CI)) | 7.0 ± 11.4 (5.5 - 8.6) | 9.2 ± 13.0 (8.0-10.5) | 0.04 |
| Hospital LOS (days, mean ± SD, 95% CI) | 9.7 ± 15.4 (7.6 - 11.8) | 12.3 ± 16.4 (10.7-13.9) | 0.06 |
| ED admitted to ICU | 63/210 (30%) | 177/423 (42%) | |
| C/PRBC ratio (ratio, mean ± SD) | 0.76 ± 0.60 | 1.80 ± 1.06 | < 0.01 |
| Mortality (n, %) | 26/63 (41%) | 66/177 (37%) | 0.58 |
| Early mortality (n, %) | 16/26 (62%) | 46/66 (70%) | 0.45 |
| Late mortality (n, %) | 10/26 (38%) | 20/66 (30%) | 0.45 |
| ED total LOS (h, mean ± SD) | 1.6 ± 1.8 (1.1 - 2.0) | 1.5 ± 1.3 (1.3 - 1.7) | 0.58 |
| ICU LOS (days, mean ± SD, 95% CI)) | 10.04 ± 12.71 | 12.06 ± 15.66 | 0.36 |
| Hospital LOS (days, mean ± SD, 95% CI) | 12.55 ± 17.60 | 16.15 ± 20.30 | 0.21 |
| ED transferred to OR | 111/210 (53%) | 187/423 (44%) | |
| C/PRBC ratio (ratio, mean ± SD) | 0.72 ± 0.52 | 1.64 ± 0.99 | < 0.01 |
| Mortality (n, %) | 51/111 (46%) | 79/187 (42%) | 0.53 |
| Early mortality (n, %) | 42/51 (82%) | 65/79 (82%) | 0.99 |
| Late mortality (n, %) | 9/51 (18%) | 14/79 (18%) | 0.99 |
| ED total LOS (h, mean ± SD) | 0.4 ± 0.4 (0.3 - 0.5) | 0.8 ± 0.8 (0.7 - 1.0) | < 0.01 |
| ICU LOS (day, mean ± SD, 95% CI) | 7.63 ± 11.74 | 9.12 ± 11.04 | 0.27 |
| Hospital LOS (days, mean ± SD, 95% CI) | 11.00 ± 15.81 | 11.82 ± 13.26 | 0.63 |