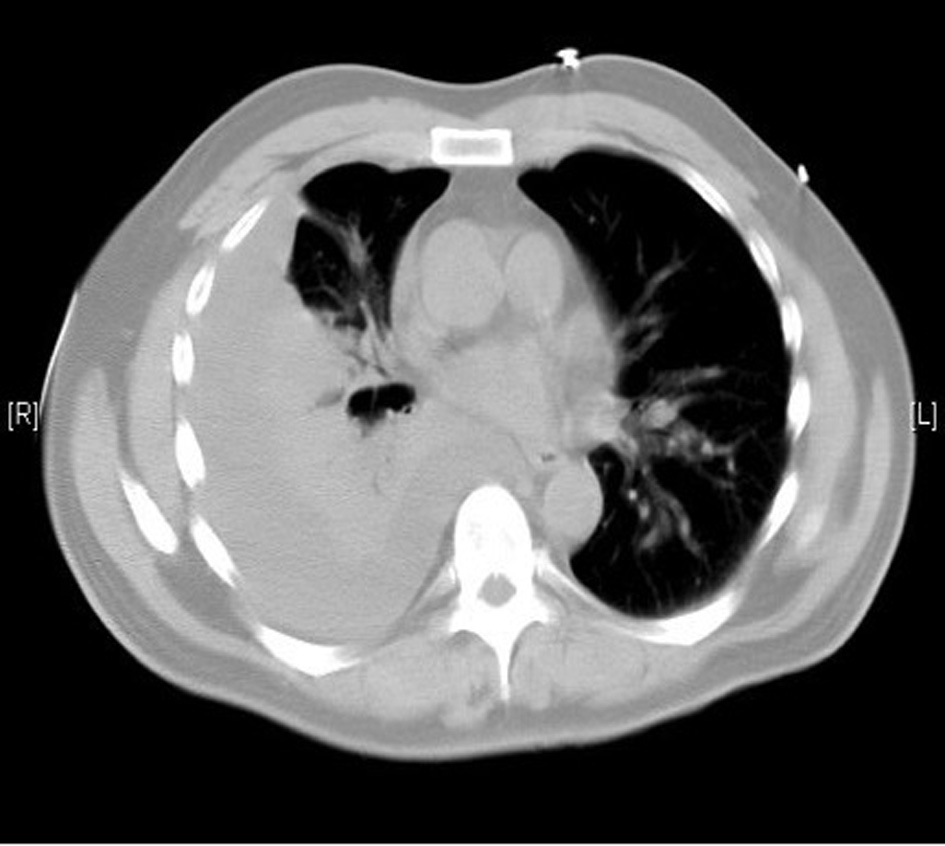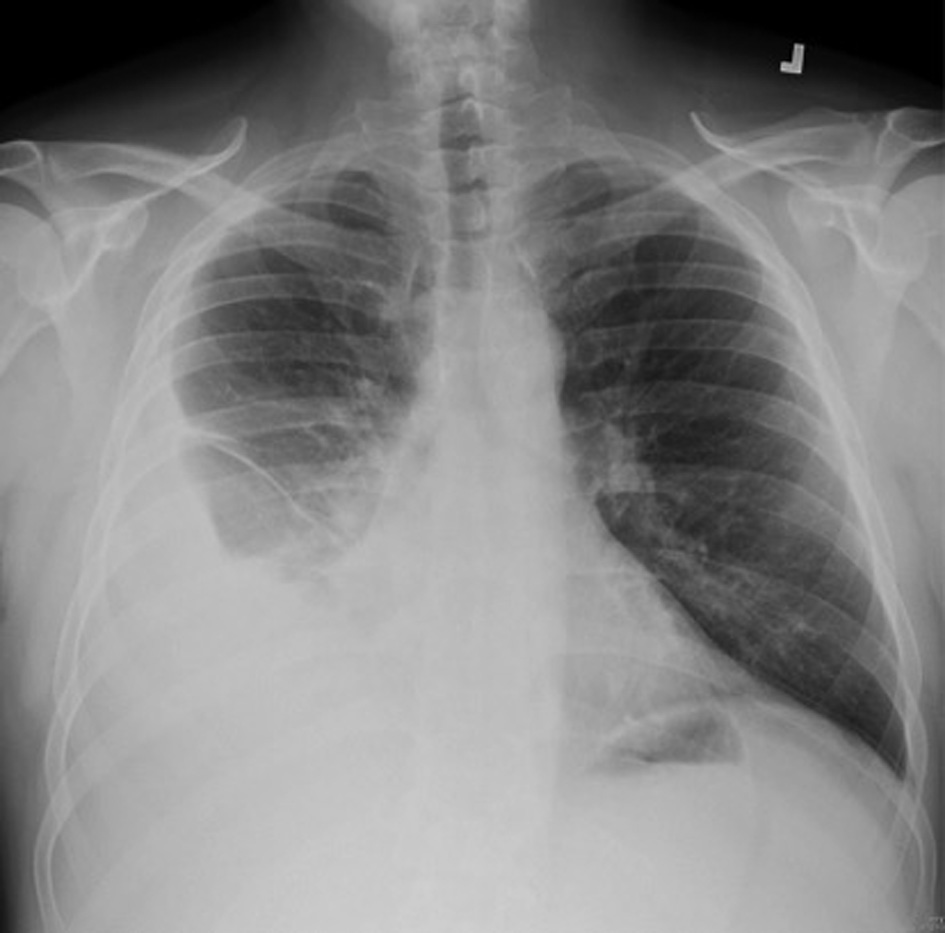
Figure 1. Right pleural effusion with associated basilar atelctasis.
| Journal of Clinical Medicine Research, ISSN 1918-3003 print, 1918-3011 online, Open Access |
| Article copyright, the authors; Journal compilation copyright, J Clin Med Res and Elmer Press Inc |
| Journal website http://www.jocmr.org |
Case Report
Volume 8, Number 1, January 2016, pages 47-51
Cryoglobulinemic Glomerulonephritis as a Presentation of Atypical Post-Infectious Glomerulonephritis
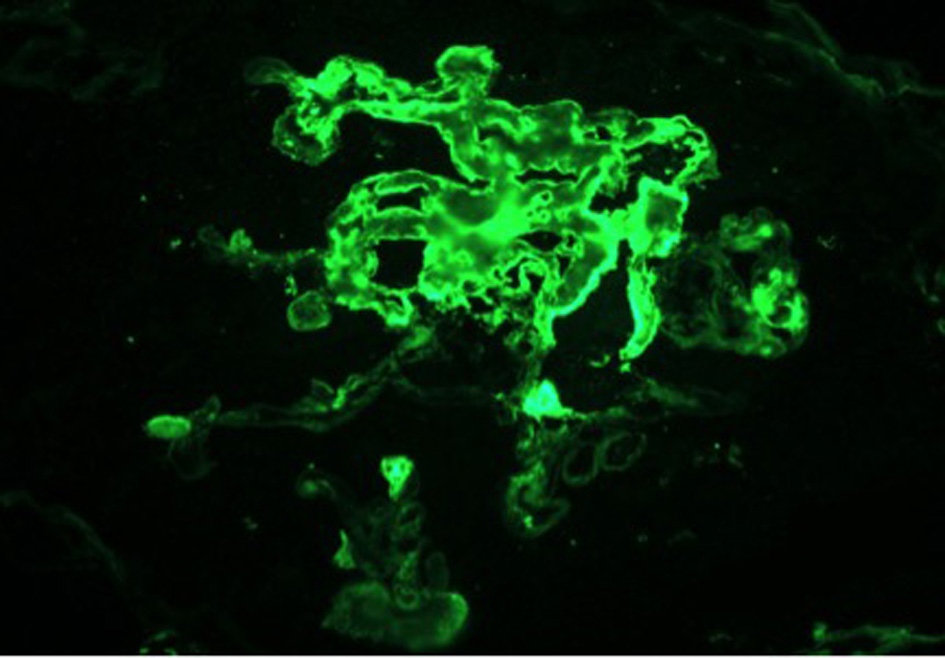
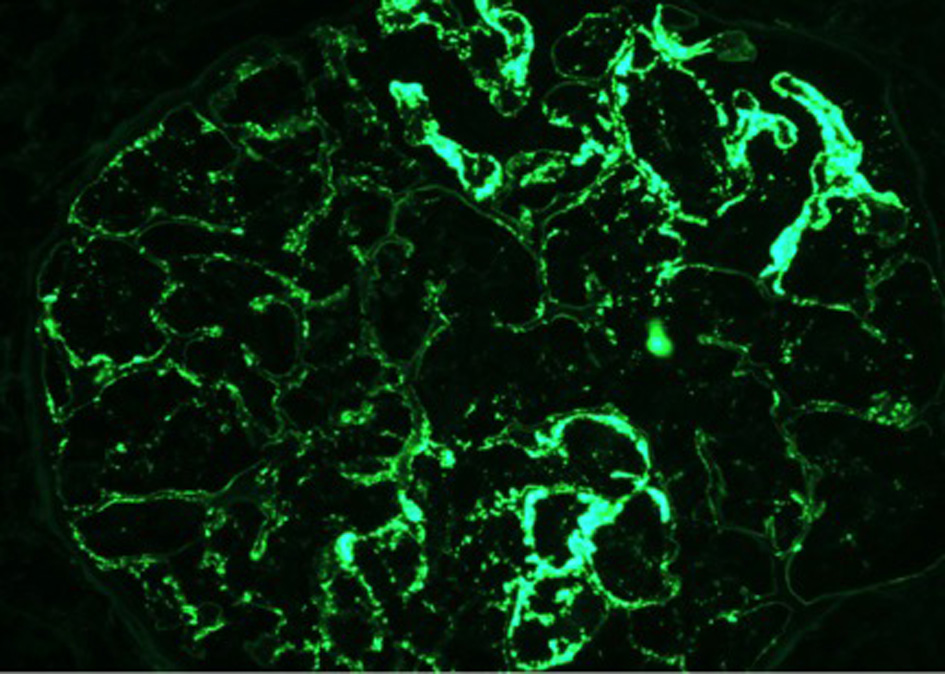
Figures