Figures
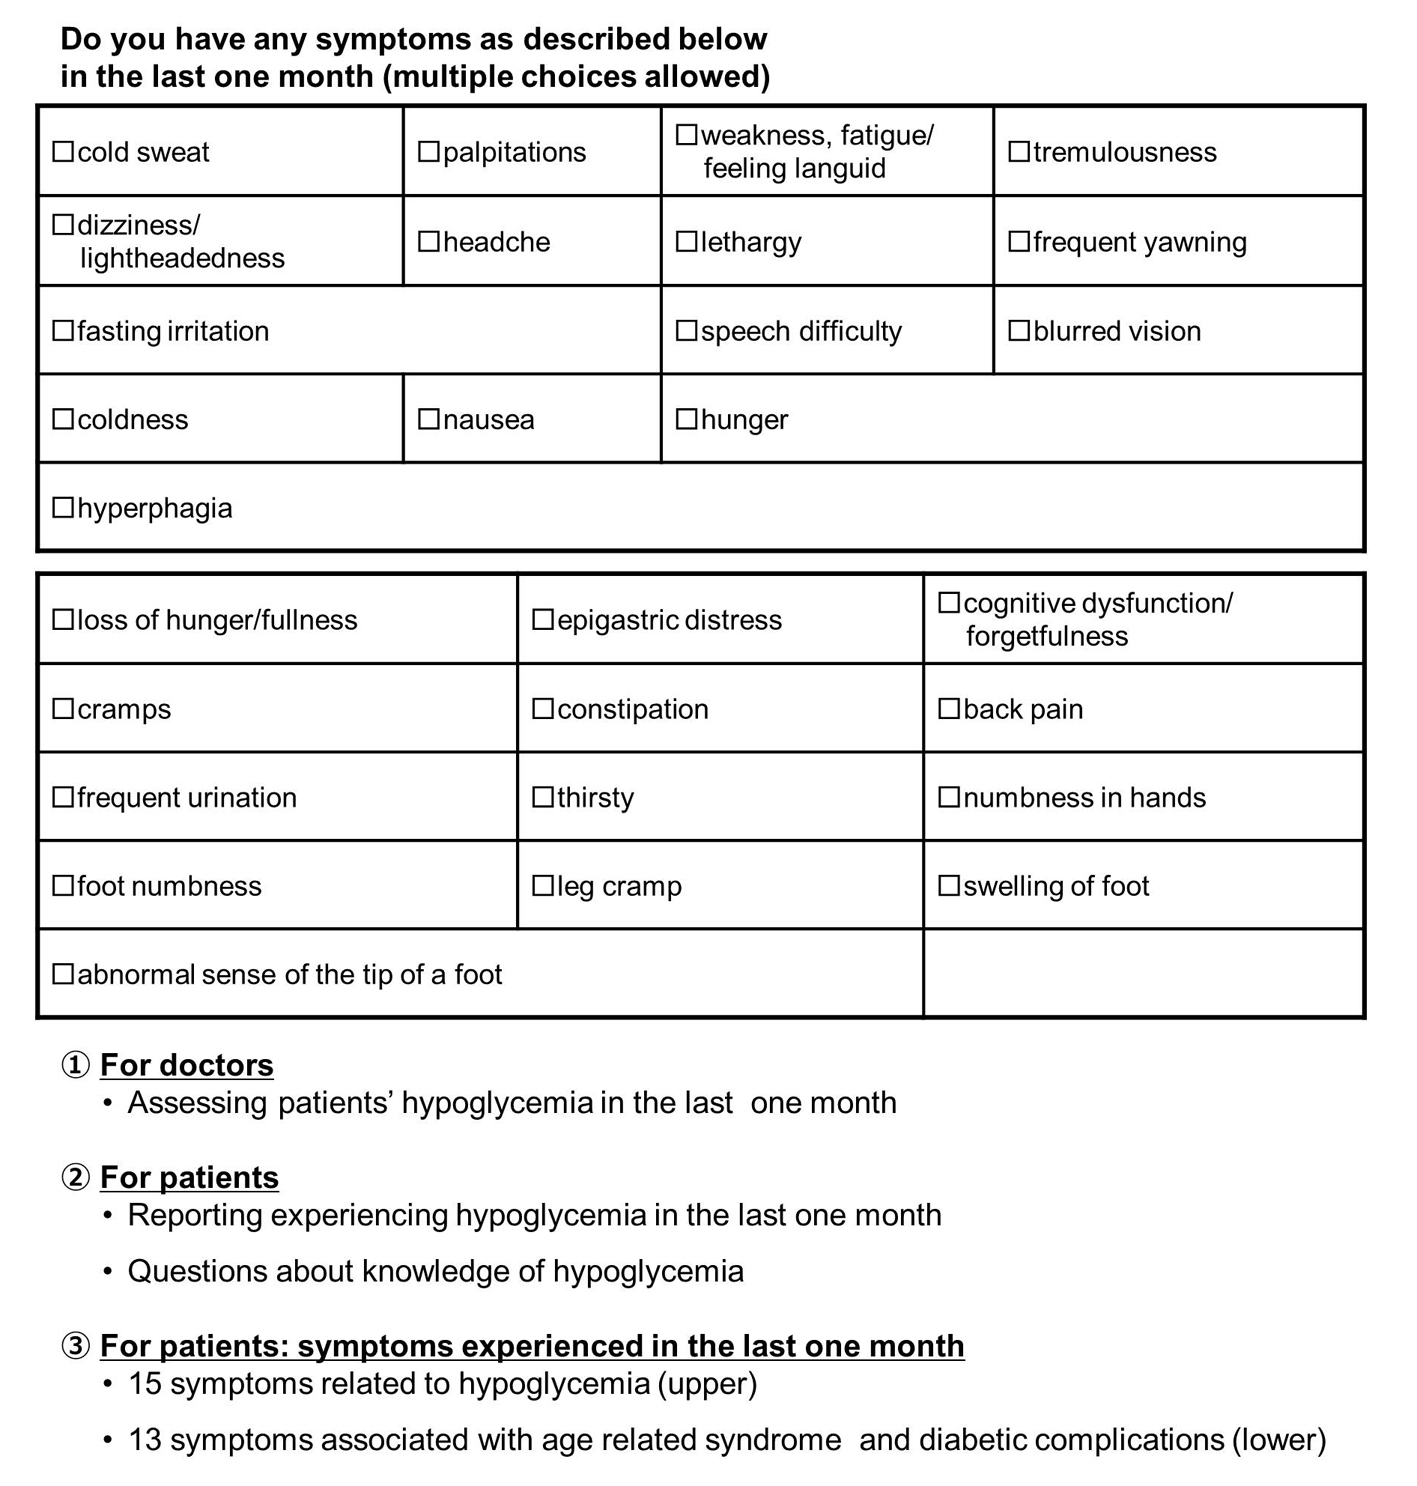
Figure 1. Questionnaire of hypoglycemia. The items were made in reference to a chapter of hypoglycemia in MEDSi Joslin Diabetes.
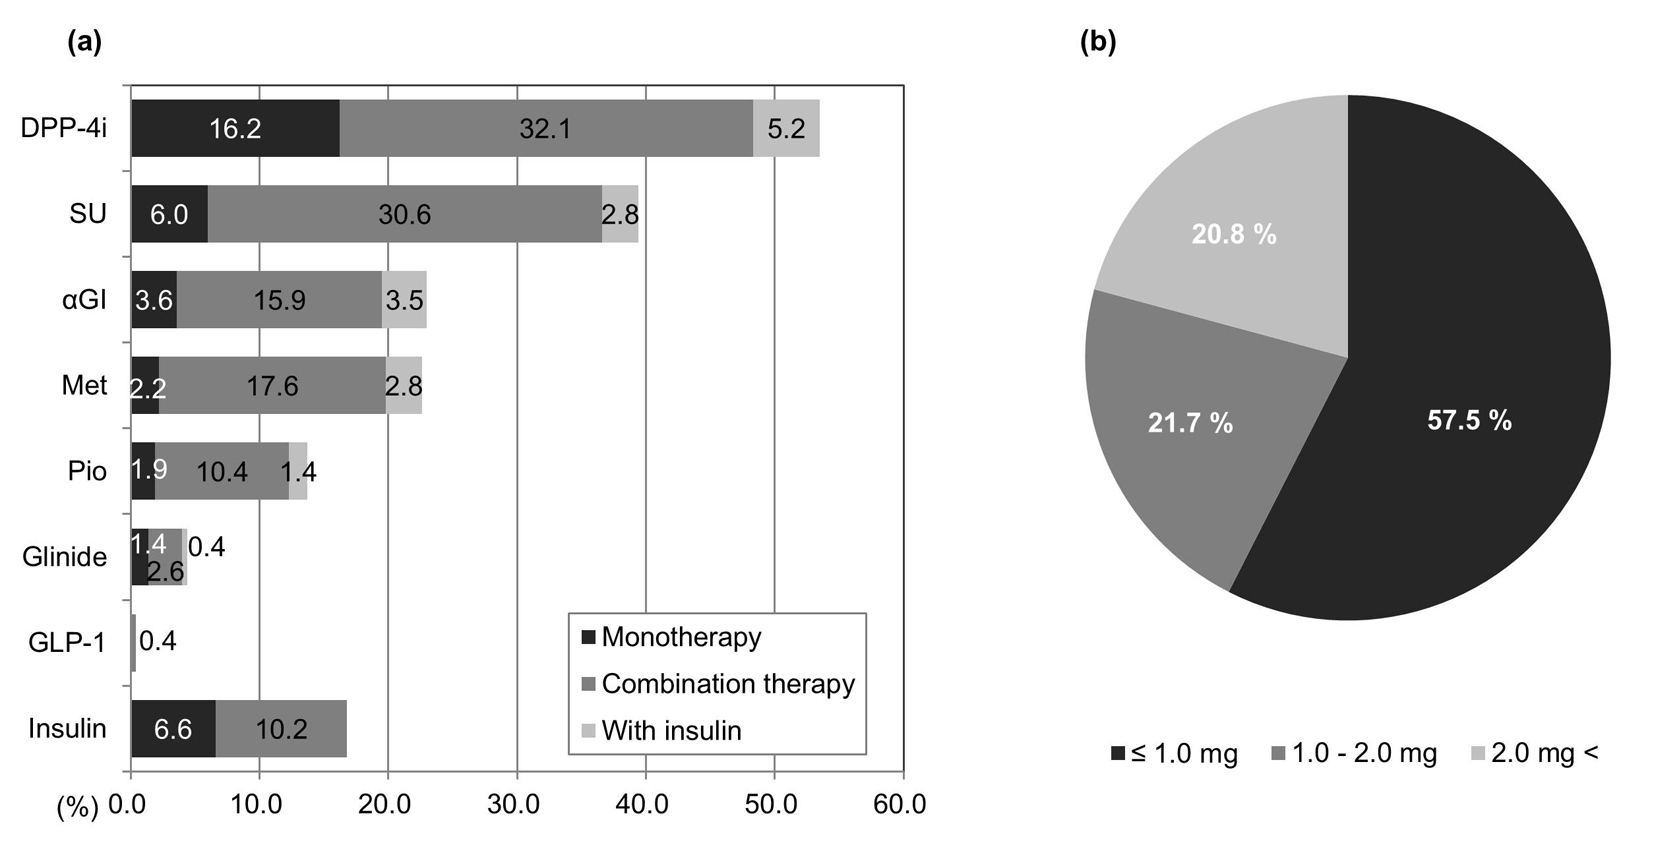
Figure 2. Trends in antidiabetic drug prescriptions. (a) Proportions of patients who were taking any one of eight drugs (n = 15,855). Met: metformin; Pio: pioglitazone. (b) Patient SU dosage/day (n = 5,825). Conversion rate: glimepiride 1 mg = gliclazide 40 mg = glibenclamide 0.625 mg.
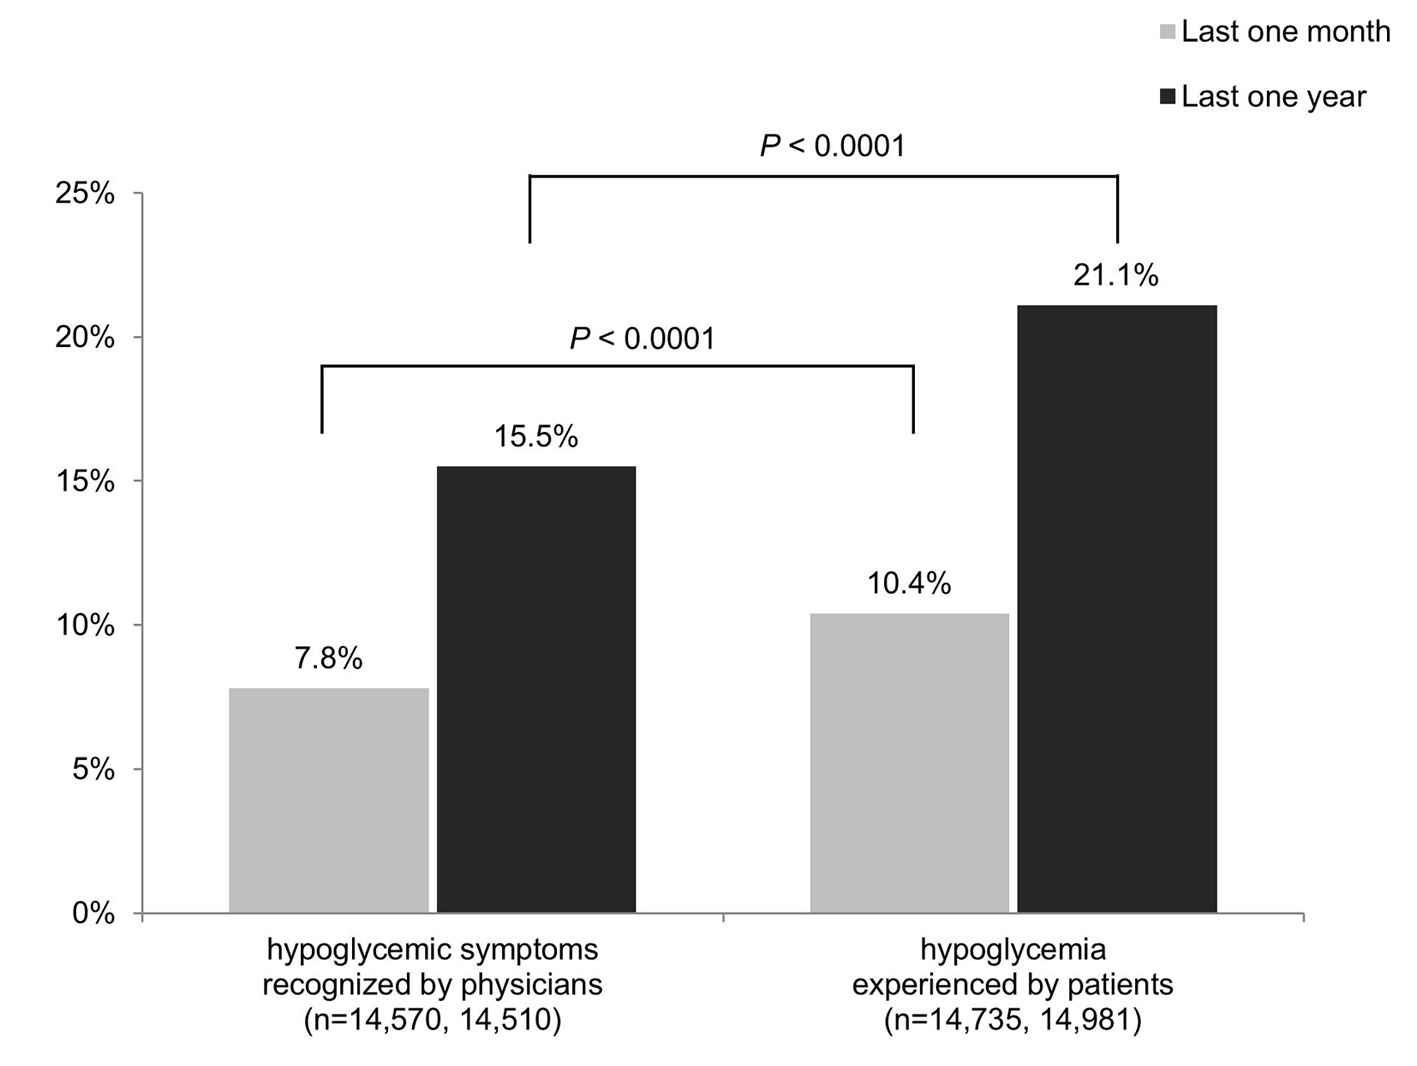
Figure 3. State of hypoglycemia.
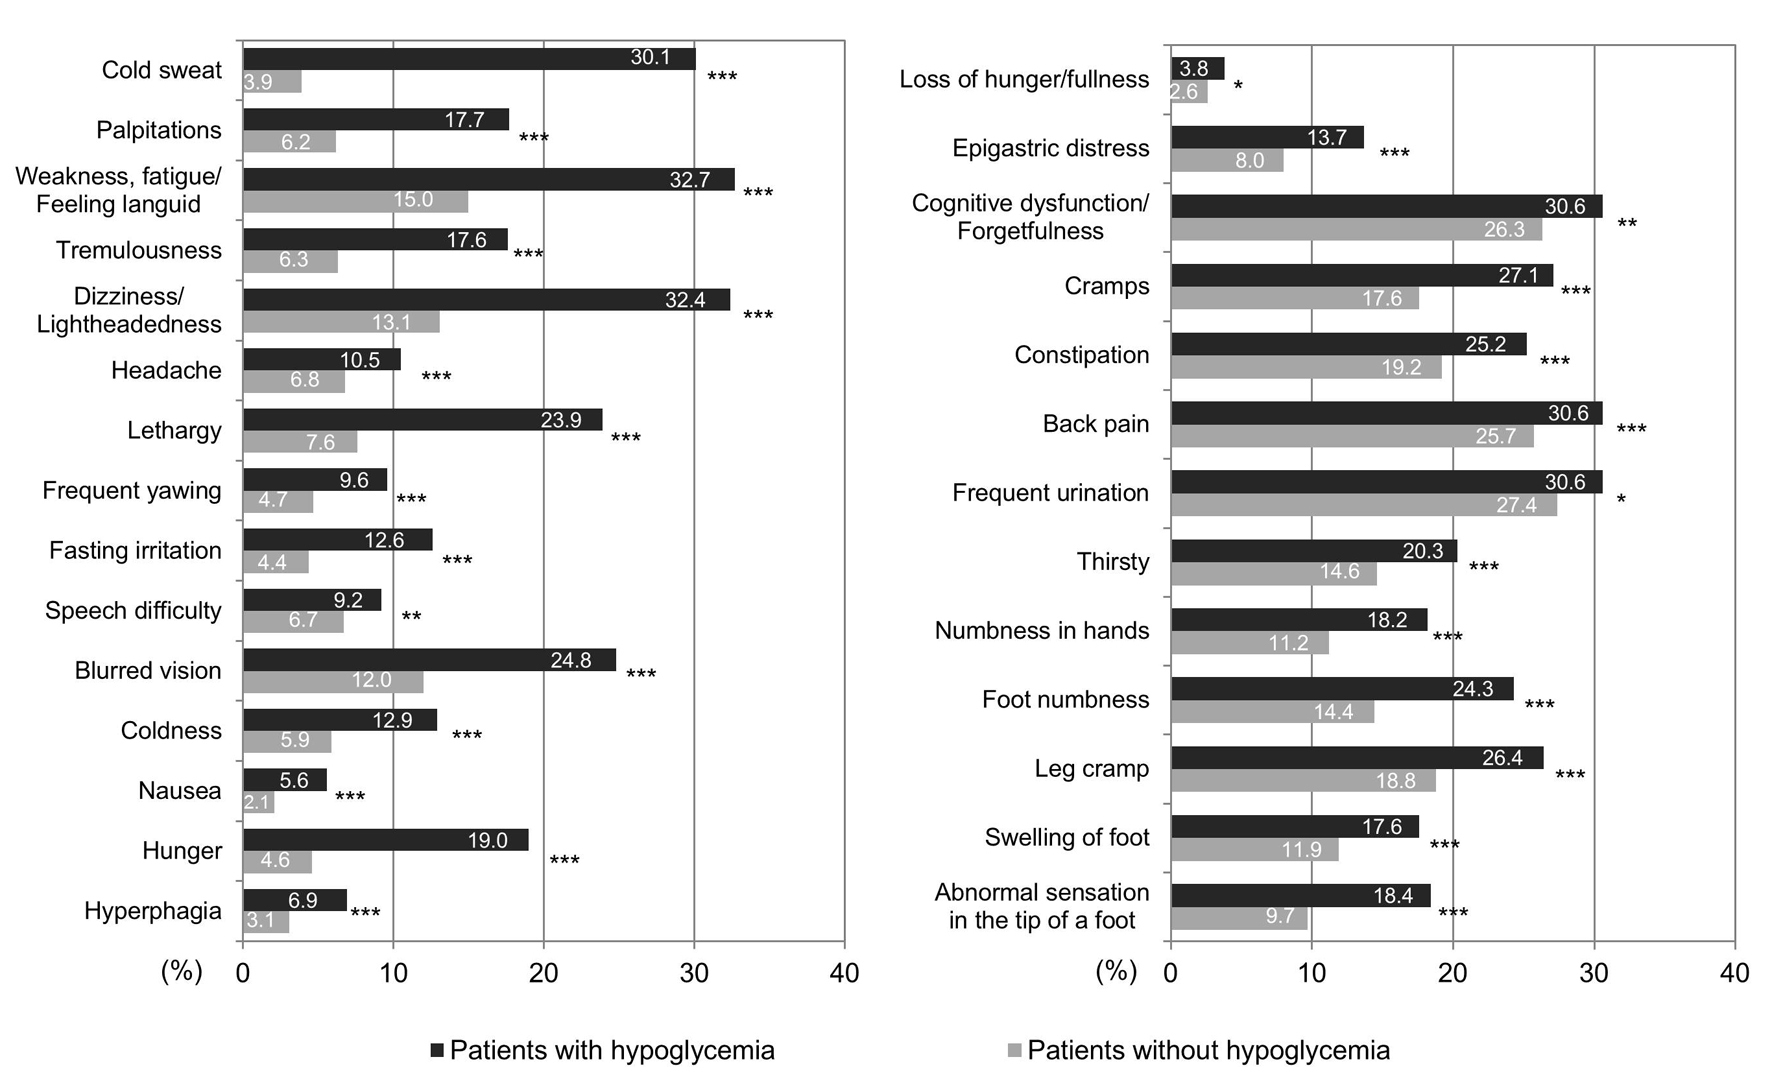
Figure 4. Hypoglycemia in patients with the 28 symptoms. Patients with hypoglycemia commonly presented with weakness, fatigue/feeling languid, dizziness/lightheadedness, cognitive dysfunction/forgetfulness, back pain, and frequent urination, and cold sweats. *P < 0.05, **P < 0.01, ***P < 0.001.
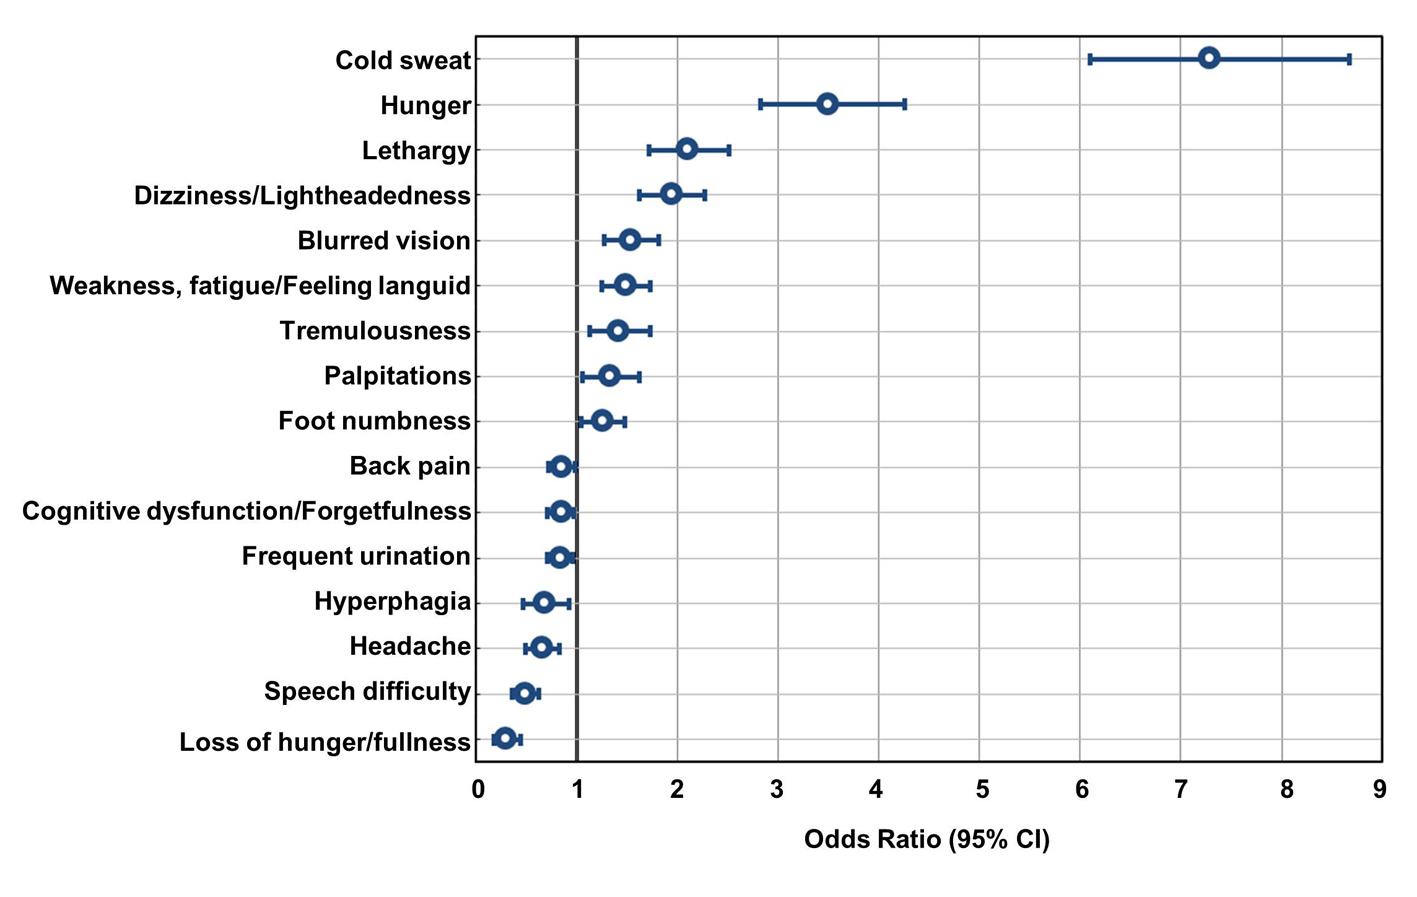
Figure 5. Associations between hypoglycemia and the symptoms. Multiple logistic regression analysis of the incidence of hypoglycemia by doctors' records in the last 1 month and the 28 self-reported symptoms by patients is shown above. “Cold sweat” and “hunger” indicated a strong positive relationship with the incidence of hypoglycemia. On the other hand, we found some symptoms like “loss of hunger/fullness” showed negative association with the incidence of hypoglycemia.
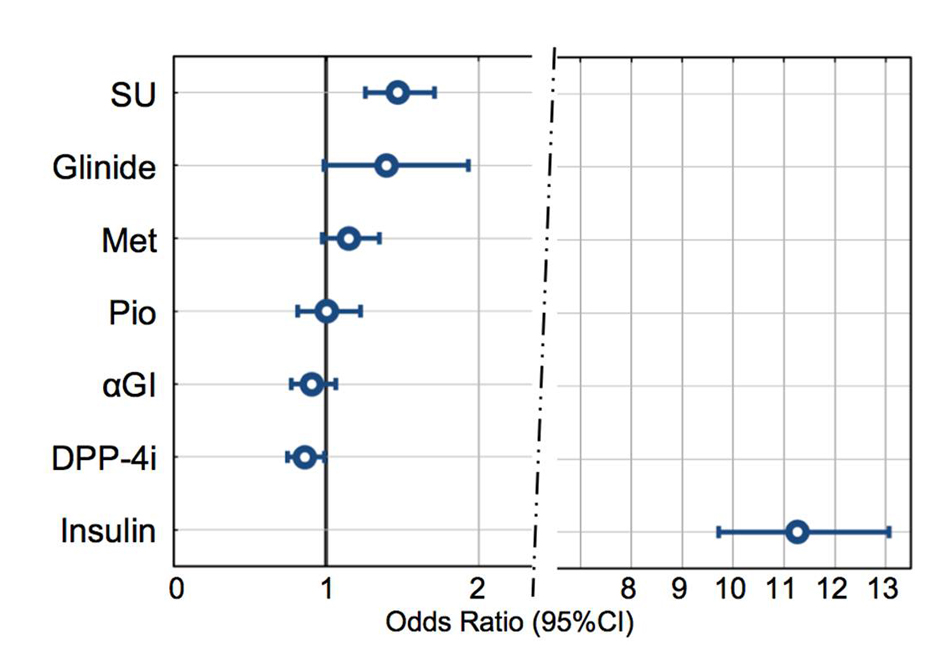
Figure 6. Associations between hypoglycemia and drugs. A multiple logistic regression analysis was performed between the incidence of hypoglycemia in the last 1 month, as assessed by doctors, as the dependent variable to analyze the associations with drug use. SU: significantly high OR (odds ratio). Glinide, Met, Pio, αGI: not significant. DPP-4i: the lowest OR (< 1). Insulin: prominently high OR. GLP-1 and other drugs were excluded from this analysis due to the lower number of patients using the drugs.
Figure 7. Hypoglycemia in the patients using SU or insulin. Percent of incidence of hypoglycemia based on doctors’ records.
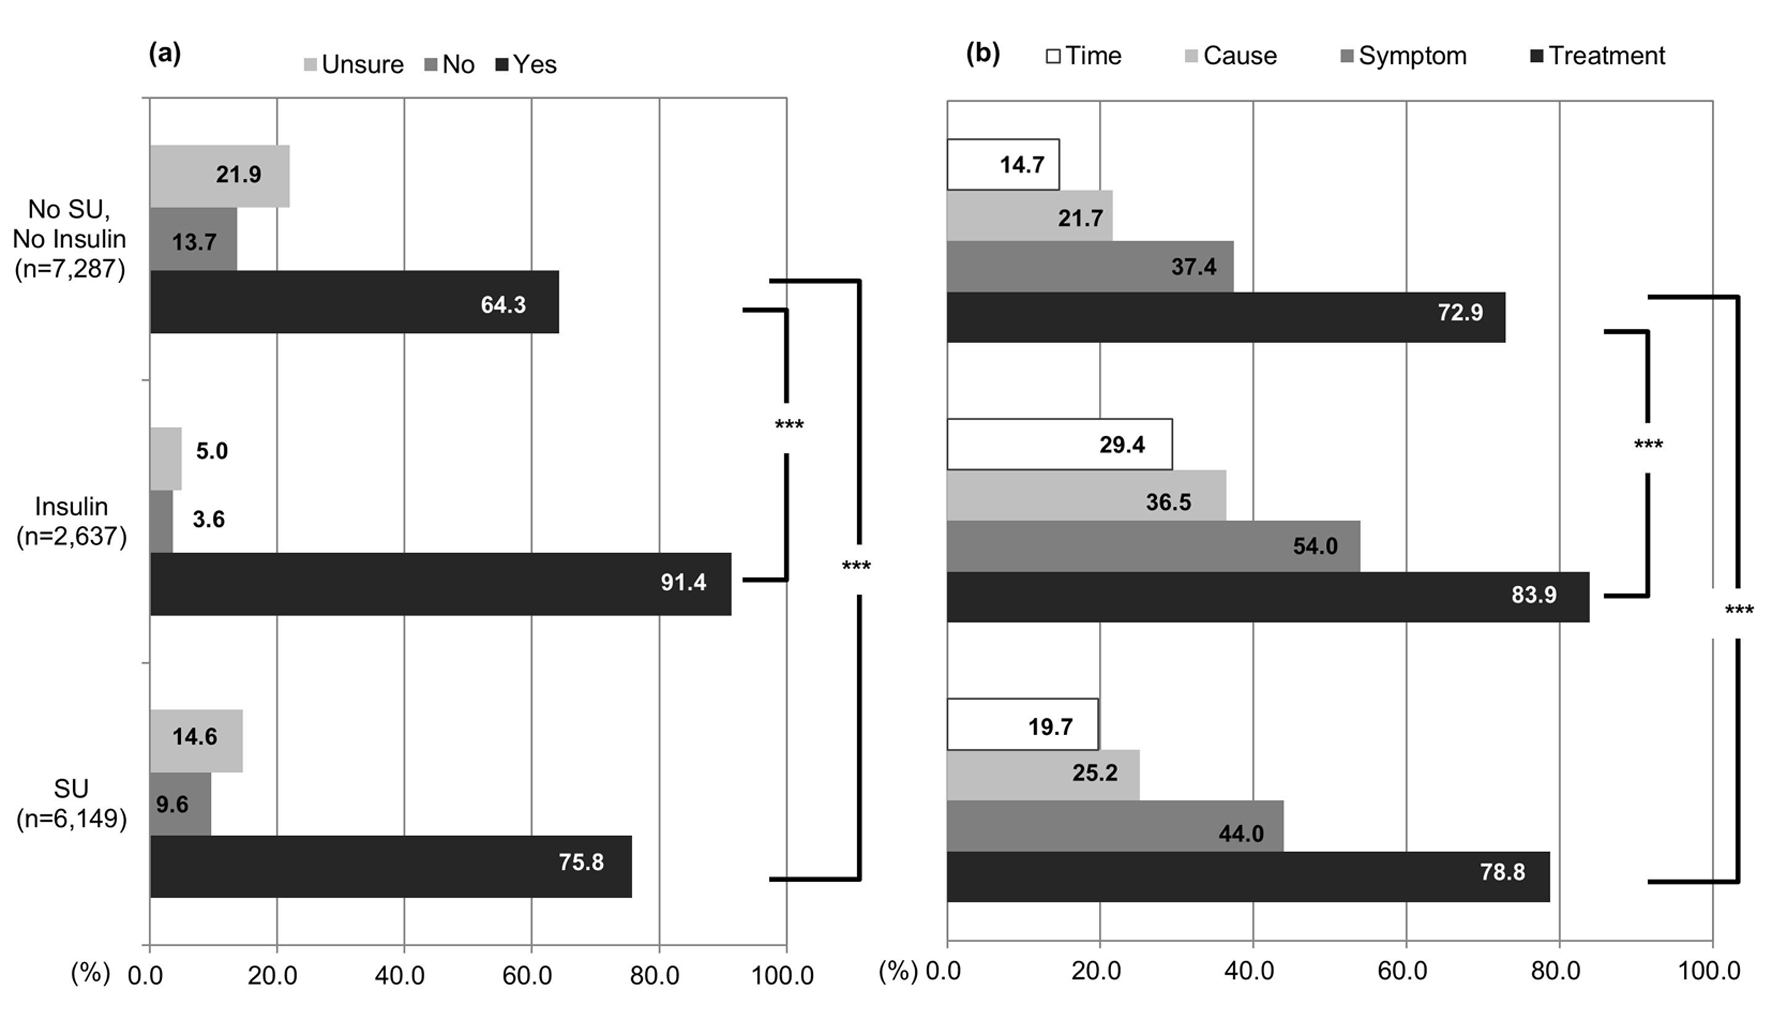
Figure 8. Knowledge of hypoglycemia. (a) “Are you aware of hypoglycemia?” Hypoglycemia awareness in elderly patients who were taking SU, insulin, or neither. (b) “What do you know about hypoglycemia?” Patients who chose “yes” to the first question answered this question. *P < 0.05, **P < 0.01, ***P < 0.001.
Tables
Table 1. Clinical Characteristics of Elderly T2DM Patients
| Mean ± SD | N |
|---|
| Registration patients, n | | 15,892 |
| Mean age, years | 74.2 ± 6.3 | 15,892 |
| Gender, females (%) | 7,516 (47.5) | 15,835 |
| Mean height, cm | 157.2 ± 9.2 | 14,886 |
| Mean weight, kg | 59.8 ± 11.1 | 15,057 |
| Mean BMI | 24.1 ± 3.7 | 14,681 |
| Diabetes | | |
| Mean disease duration, years | 12.8 ± 8.9 | |
| Mean onset age, years | 61.4 ± 10.0 | |
| Mean fasting blood sugar level, mg/dL | 128.7 ± 34.1 | 3,562 |
| Mean HbA1c, % (NGSP) | 7.0 ± 1.0 | 15,426 |
| Diabetic retinopathy, n (%) | 2,424 (16.0) | 15,114 |
| Diabetic nephropathy, n (%) | 3,995 (26.3) | 15,206 |
| Diabetic neuropathy, n (%) | 3,091 (20.5) | 15,064 |
| Medical history | | |
| Cardiovascular disease, n (%) | 2,278 (15.9) | |
| Cerebrovascular disease, n (%) | 1,501 (10.5) | |
Table 2. Hypoglycemia Symptoms and Age (Total N = 1,142)
| 65 - 70 (n = 312) | 70 - 75 (n = 327) | 75 - 80 (n = 298) | ≥ 80 (n = 205) | P value* |
|---|
| *Cochran-Armitage trend test. |
| Cold sweat | 32.1 | 31.2 | 31.2 | 24.1 | 0.09 |
| Dizziness/lightheadedness | 27.6 | 31.5 | 34.6 | 41.4 | 0.01 |
| Weakness, fatigue/feeling languid | 29.5 | 29.1 | 37.2 | 33.8 | 0.02 |
| Blurred vision | 22.4 | 25.4 | 26.8 | 26.2 | 0.46 |
| Lethargy | 24.7 | 20.2 | 21.8 | 31.7 | 0.13 |