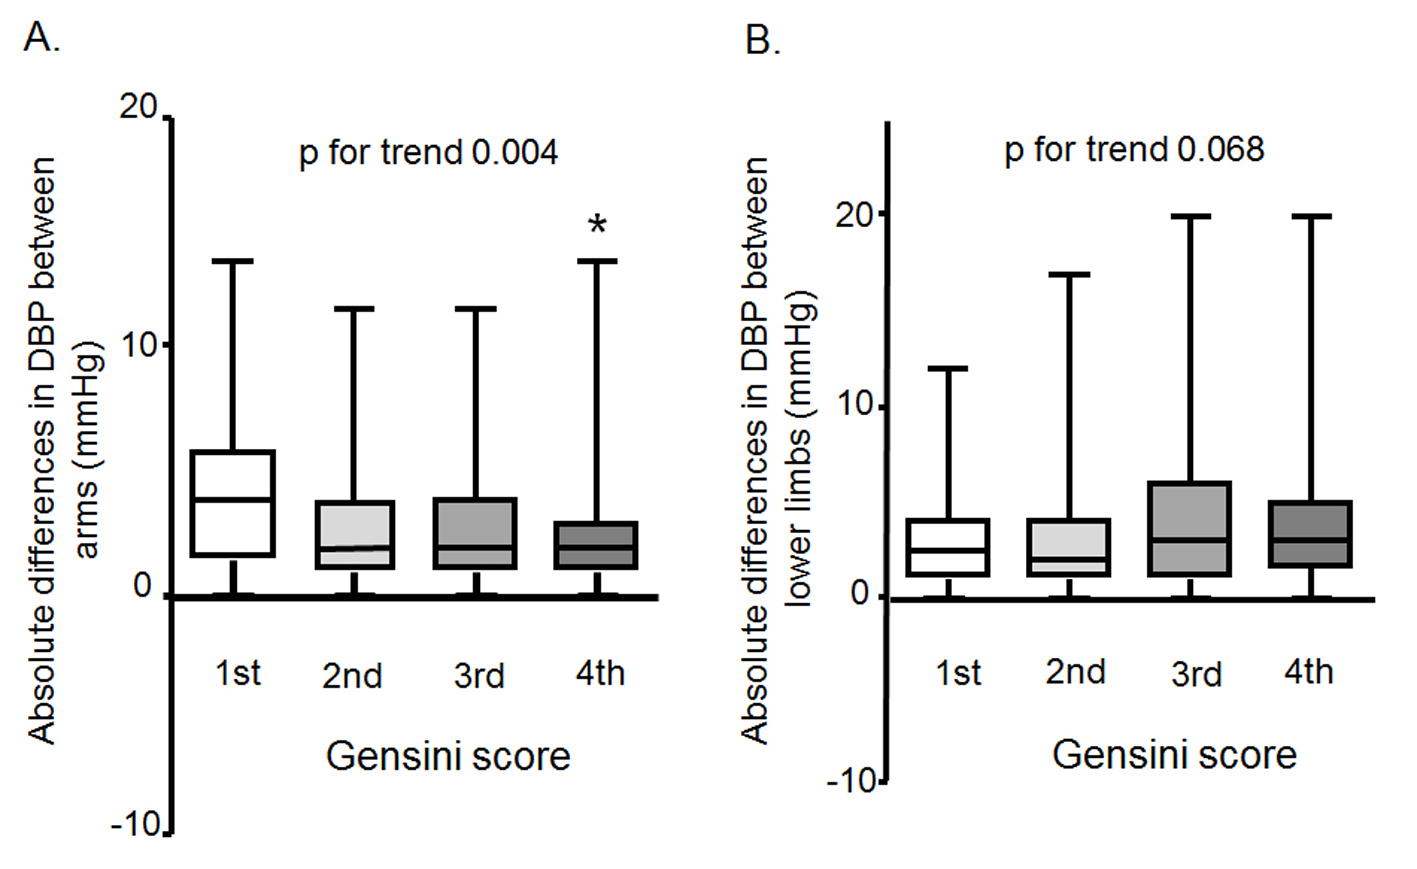
Figure 1. Associations between the absolute difference in DBP between arms (A) or lower limbs (B) and the Gensini score.
| Journal of Clinical Medicine Research, ISSN 1918-3003 print, 1918-3011 online, Open Access |
| Article copyright, the authors; Journal compilation copyright, J Clin Med Res and Elmer Press Inc |
| Journal website http://www.jocmr.org |
Original Article
Volume 7, Number 11, November 2015, pages 873-879
Impact of the Absolute Difference in Diastolic Blood Pressure Between Arms in Patients With Coronary Artery Disease
Figures
Tables
| All (n = 277) | Non-CAD (n = 86) | CAD (n = 191) | |
|---|---|---|---|
| BMI: body mass index; HTN: hypertension; DL: dyslipidemia; HDL-C: high-density lipoprotein cholesterol; LDL-C: low-density lipoprotein cholesterol; TG: triglyceride; DM: diabetes mellitus; HbA1c: hemoglobin A1c; HU: hyperurecemia; UA: uric acid; eGFR: estimated glomerular filtration rate; baPWV: brachial-ankle pulse wave velocity; ARB/ACE-I: angiotensin II receptor blocker/angiotensin converting enzyme inhibitor; CCB: calcium channel blocker. *P < 0.05 vs. non-CAD group. | |||
| Age, years | 66.5 ± 9.8 | 65.2 ± 10.8 | 67.1 ± 9.3 |
| Male, n (%) | 193 (70) | 47 (55) | 146 (76)* |
| BMI, kg/m2 | 23.7 ± 3.3 | 23.3 ± 3.3 | 23.9 ± 3.3 |
| Family history, n (%) | 63 (23) | 13 (15) | 50 (26)* |
| Smoking, n (%) | 146 (53) | 37 (43) | 109 (57)* |
| HTN, n (%) | 213 (77) | 53 (62) | 160 (84)* |
| DL, n (%) | 232 (84) | 58(67) | 174 (91)* |
| HDL-C, mg/dL | 52 ± 13 | 58 ± 13 | 50 ± 12* |
| LDL-C, mg/dL | 103 ± 30 | 115 ± 29 | 97 ± 29* |
| TG, mg/dL | 132 ± 74 | 124 ± 61 | 136±79 |
| DM, n (%) | 107 (39) | 17 (20) | 90 (47)* |
| HbA1c, % | 6.1 ± 1.1 | 5.8±0.8 | 6.2 ± 1.2* |
| HU, n (%) | 50 (18) | 15(17) | 35 (18) |
| UA, mg/dL | 5.4 ± 1.3 | 5.3 ± 1.2 | 5.5 ± 1.3 |
| eGFR, mL/min/1.73 cm2 | 64 ± 16 | 66 ± 14 | 63 ± 16 |
| baPWV (mean), cm/s | 1,734 ± 368 | 1,694 ± 315 | 1,753 ± 389 |
| Medication, n (%) | |||
| ARB/ACE-I | 177 (64) | 14 (16) | 47 (25)* |
| CCB | 134 (48) | 31 (36) | 103 (54)* |
| α-blocker | 3 (1) | 0 | 3 (2) |
| β-blocker | 43 (16) | 8 (9) | 35 (18)* |
| Diuretics | 40 (14) | 10 (12) | 30 (16) |
| Statin | 192 (69) | 32 (37) | 160 (84)* |
| Ezemitibe | 22 (8) | 3 (3) | 19 (10) |
| Insulin | 15 (5) | 2 (2) | 13 (7) |
| Sulfonyurea | 34 (12) | -11 | 25 (13) |
| Pioglitazone | 6 (2) | 1 (1) | 5 (3) |
| All (n = 277) | Non-CAD (n = 86) | CAD (n = 191) | |
|---|---|---|---|
| Rt. SBP: right systolic blood pressure; Lt. SBP: left SBP; M. SBP: mean SBP; Rt. DBP: right diastolic BP; Lt. DBP: left DBP; M. DBP: mean DBP; Dif. BP arms: differences in BP between arms; Dif. BP limbs: differences in BP between lower limbs. *P < 0.05 vs. non-CAD group. | |||
| Rt. SBP arm, mm Hg | 130.4 ± 18.0 | 132.8 ± 19.3 | 129.3 ± 17.4 |
| Lt. SBP arm, mm Hg | 129.9 ± 18.0 | 132.5 ± 18.7 | 128.7 ± 17.6 |
| M. SBP arm, mm Hg | 130.1 ± 17.8 | 132.6 ± 18.7 | 129.0 ± 17.3 |
| Rt. DBP arm, mm Hg | 76.1 ± 10.4 | 78.4 ± 11.0 | 75.0 ± 9.9* |
| Lt. DBP arm, mm Hg | 75.8 ± 10.1 | 78.1 ± 10.6 | 74.8 ± 9.8* |
| M. DBP arm, mm Hg | 75.9 ± 10.1 | 78.2 ± 10.6 | 74.9 ± 9.7* |
| Rt. SBP lower limb, mm Hg | 147.3 ± 26.7 | 152.5 ± 23.2 | 144.9 ± 27.9* |
| Lt. SBP lower limb, mm Hg | 145.5 ± 24.7 | 151.1 ± 22.1 | 143.0 ± 25.5* |
| M. SBP lower limb, mm Hg | 146.4 ± 24.9 | 151.8 ± 22.2 | 144.0 ± 25.8* |
| Rt. DBP lower limb, mm Hg | 74.0 ± 10.7 | 77.0 ± 10.5 | 72.6 ± 10.5* |
| Lt. DBP lower limb, mm Hg | 74.7 ± 10.7 | 77.1 ± 10.6 | 73.6 ± 10.6* |
| M. DBP lower limb, mm Hg | 74.3 ± 10.4 | 77.1 ± 10.4 | 73.1 ± 10.2* |
| Absolute Dif. SBP arms, mm Hg | 3.2 ± 3.1 | 3.0 ± 2.6 | 3.3 ± 3.4 |
| Relative Dif. SBP arms, mm Hg | 0.7 ± 4.4 | 0.8 ± 3.9 | 0.6 ± 4.6 |
| Absolute Dif. SBP limbs, mm Hg | 7.5 ± 8.6 | 6.6 ± 6.1 | 7.9 ± 9.5 |
| Relative Dif. SBP limbs, mm Hg | 2.3 ± 11.2 | 1.6 ± 8.9 | 2.4 ± 12.2 |
| Absolute Dif. DBP arms, mm Hg | 3.1 ± 2.7 | 3.7 ± 3.0 | 2.7 ± 2.6* |
| Relative Dif. DBP arms, mm Hg | 0.2 ± 4.1 | 0.1 ± 4.8 | 0.2 ± 3.7 |
| Absolute Dif. DBP limbs, mm Hg | 3.4 ± 3.3 | 2.8 ± 2.6 | 3.7 ± 3.5* |
| Relative Dif. DBP limbs, mm Hg | 3.2 ± 3.1 | 3.0 ± 2.6 | 3.3 ± 3.4 |
| SBP absolute arms ≥ 10 mm Hg, n (%) | 12 (4) | 2 (20) | 10 (5) |
| DBP absolute arms ≥ 10 mm Hg, n (%) | 10 (4) | 5 (16) | 5 (3) |
| SBP absolute lower limbs ≥ 10 mm Hg, n (%) | 69 (24) | 17 (19) | 52 (27) |
| DBP absolute lower limbs ≥ 10 mm Hg, n (%) | 1 (6) | 4 (5) | 12 (6) |
| baPWV (mean) | Absolute Dif. DBP arms | Absolute Dif. DBP limbs | ||||
|---|---|---|---|---|---|---|
| r | P value | r | P value | r | P value | |
| BMI: body mass index; M. SBP: mean systolic blood pressure; M. DBP: mean diastolic BP; LDL-C: low-density lipoprotein cholesterol; HDL-C: high-density lipoprotein cholesterol; TG: triglyceride; HbA1c: hemoglobin A1c; eGFR: estimated glomerular filtration rate; UA: uric acid; baPWV: brachial-ankle pulse wave velocity; Dif. BP arms: differences in BP between arms; Dif. BP limbs: differences in BP between lower limbs. *P < 0.05 vs. non-CAD group. | ||||||
| Age, years | 0.52 | < 0.0001 | 0.03 | 0.68 | 0.11 | 0.08 |
| BMI, kg/m2 | -0.13 | 0.03 | 0.11 | 0.08 | -0.07 | 0.26 |
| M. SBP arm, mm Hg | 0.36 | < 0.0001 | 0.11 | 0.06 | 0.10 | 0.10 |
| M. DBP arm, mm Hg | 0.12 | 0.04 | 0.09 | 0.15 | 0.02 | 0.72 |
| M. SBP lower limb, mm Hg | 0.42 | < 0.0001 | 0.04 | 0.46 | -0.02 | 0.78 |
| M. DBP lower limb, mm Hg | 0.27 | < 0.0001 | 0.05 | 0.44 | -0.12 | 0.04 |
| LDL-C, mg/dL | -0.01 | 0.77 | 0.06 | 0.34 | -0.12 | 0.05 |
| HDL-C, mg/dL | -0.01 | 0.86 | 0.01 | 0.81 | -0.13 | 0.04 |
| TG, mg/dL | -0.05 | 0.38 | -0.02 | 0.73 | -0.06 | 0.31 |
| HbA1c, % | 0.14 | 0.02 | -0.11 | 0.06 | 0.01 | 0.83 |
| eGFR, mL/min/1.73 cm2 | -0.26 | < 0.0001 | 0.02 | 0.80 | -0.16 | 0.01 |
| UA, mg/dL | -0.07 | 0.26 | -0.0003 | 0.99 | 0.04 | 0.48 |
| baPWV (mean), cm/s | - | - | -0.04 | 0.50 | 0.05 | 0.41 |
| Absolute Dif. DBP arms, mm Hg | -0.04 | 0.50 | - | - | 0.07 | 0.28 |
| Absolute Dif. DBP limbs, mm Hg | 0.05 | 0.41 | 0.07 | 0.28 | - | - |