Figure 1. Wilschanski index.
| Journal of Clinical Medicine Research, ISSN 1918-3003 print, 1918-3011 online, Open Access |
| Article copyright, the authors; Journal compilation copyright, J Clin Med Res and Elmer Press Inc |
| Journal website http://www.jocmr.org |
Original Article
Volume 8, Number 1, January 2016, pages 15-24
Repeatability and Diagnostic Value of Nasal Potential Difference in a Genetically Admixed Population
Figures

Tables
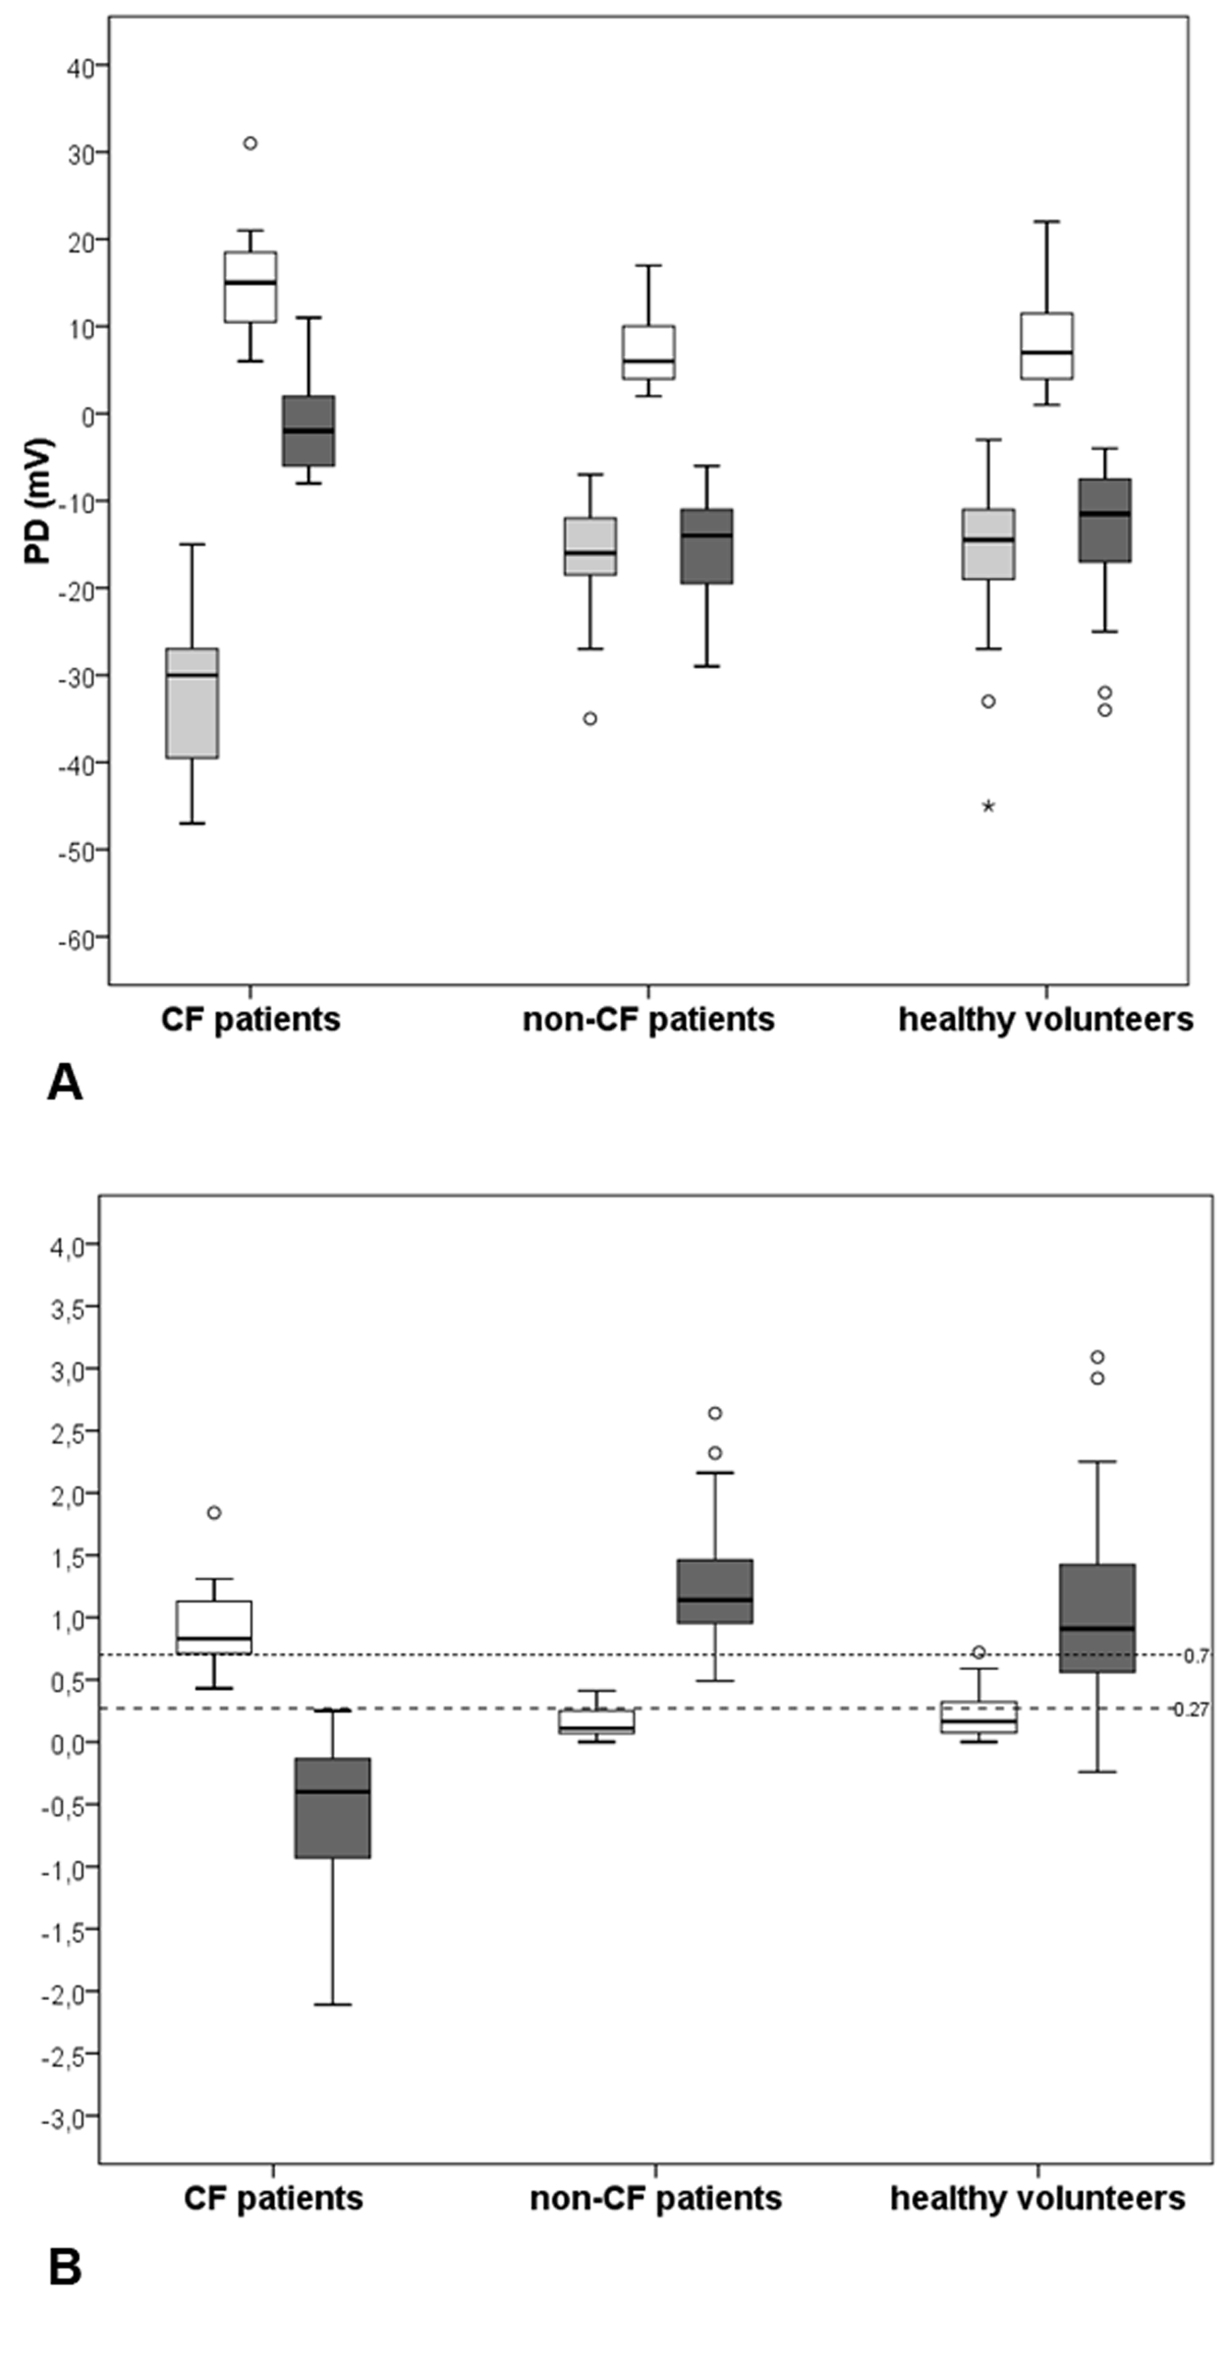
| Groups (n) | PDmaxa | Δamilb | TCRc | Wilschanski indexd | Sermet scoree |
|---|---|---|---|---|---|
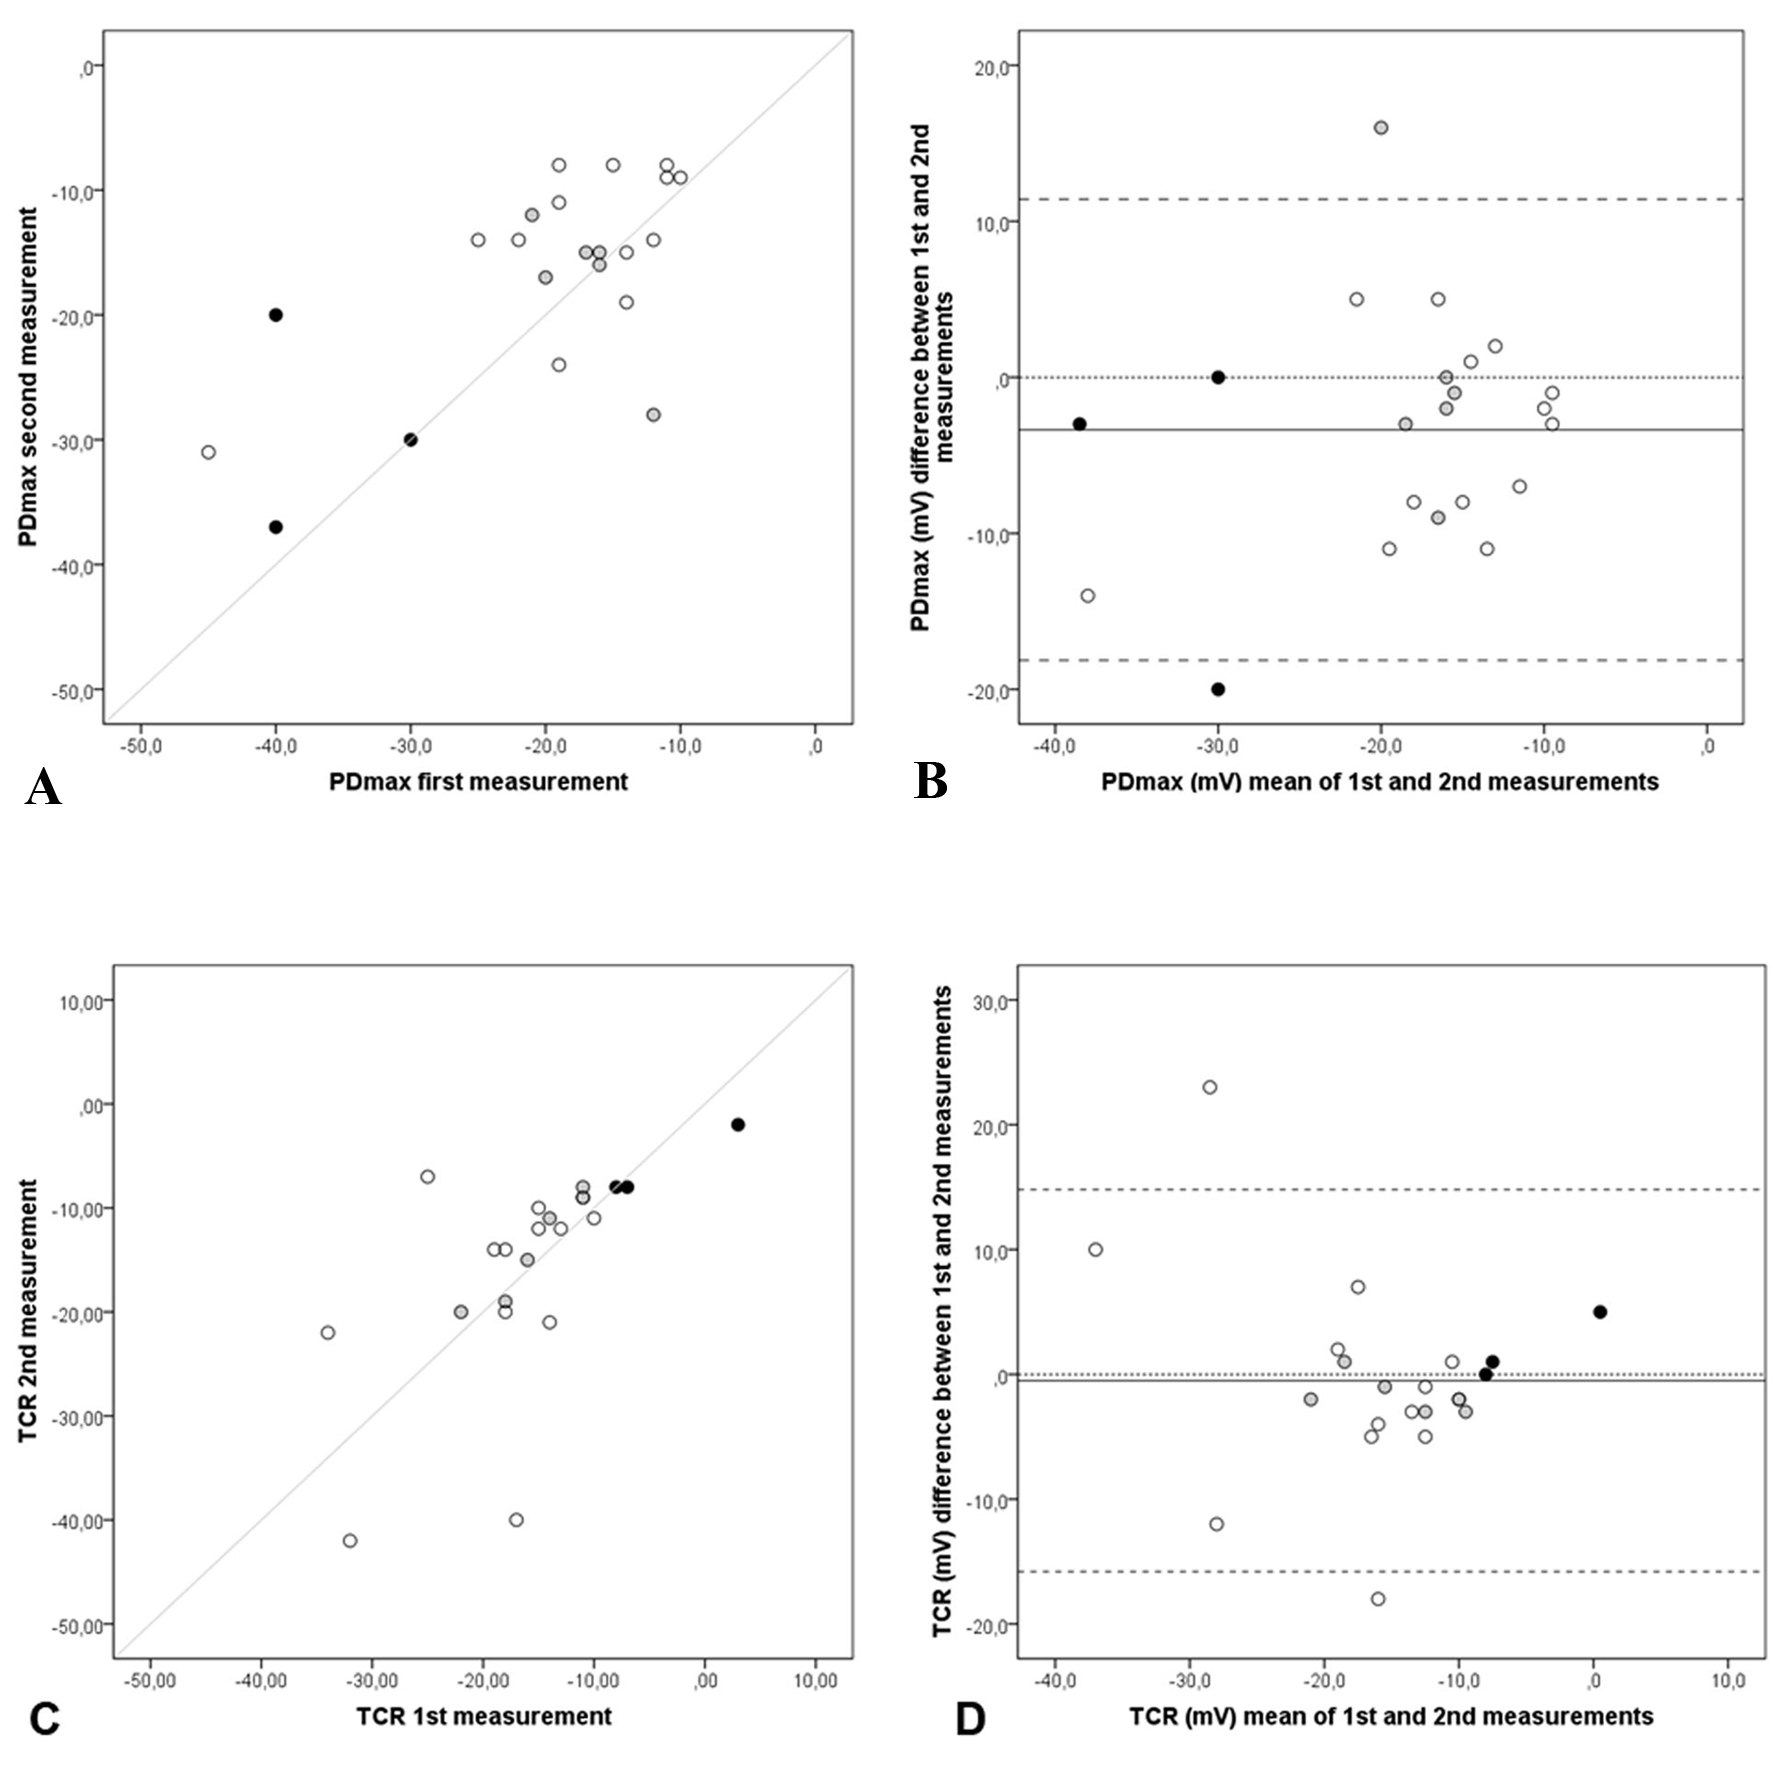
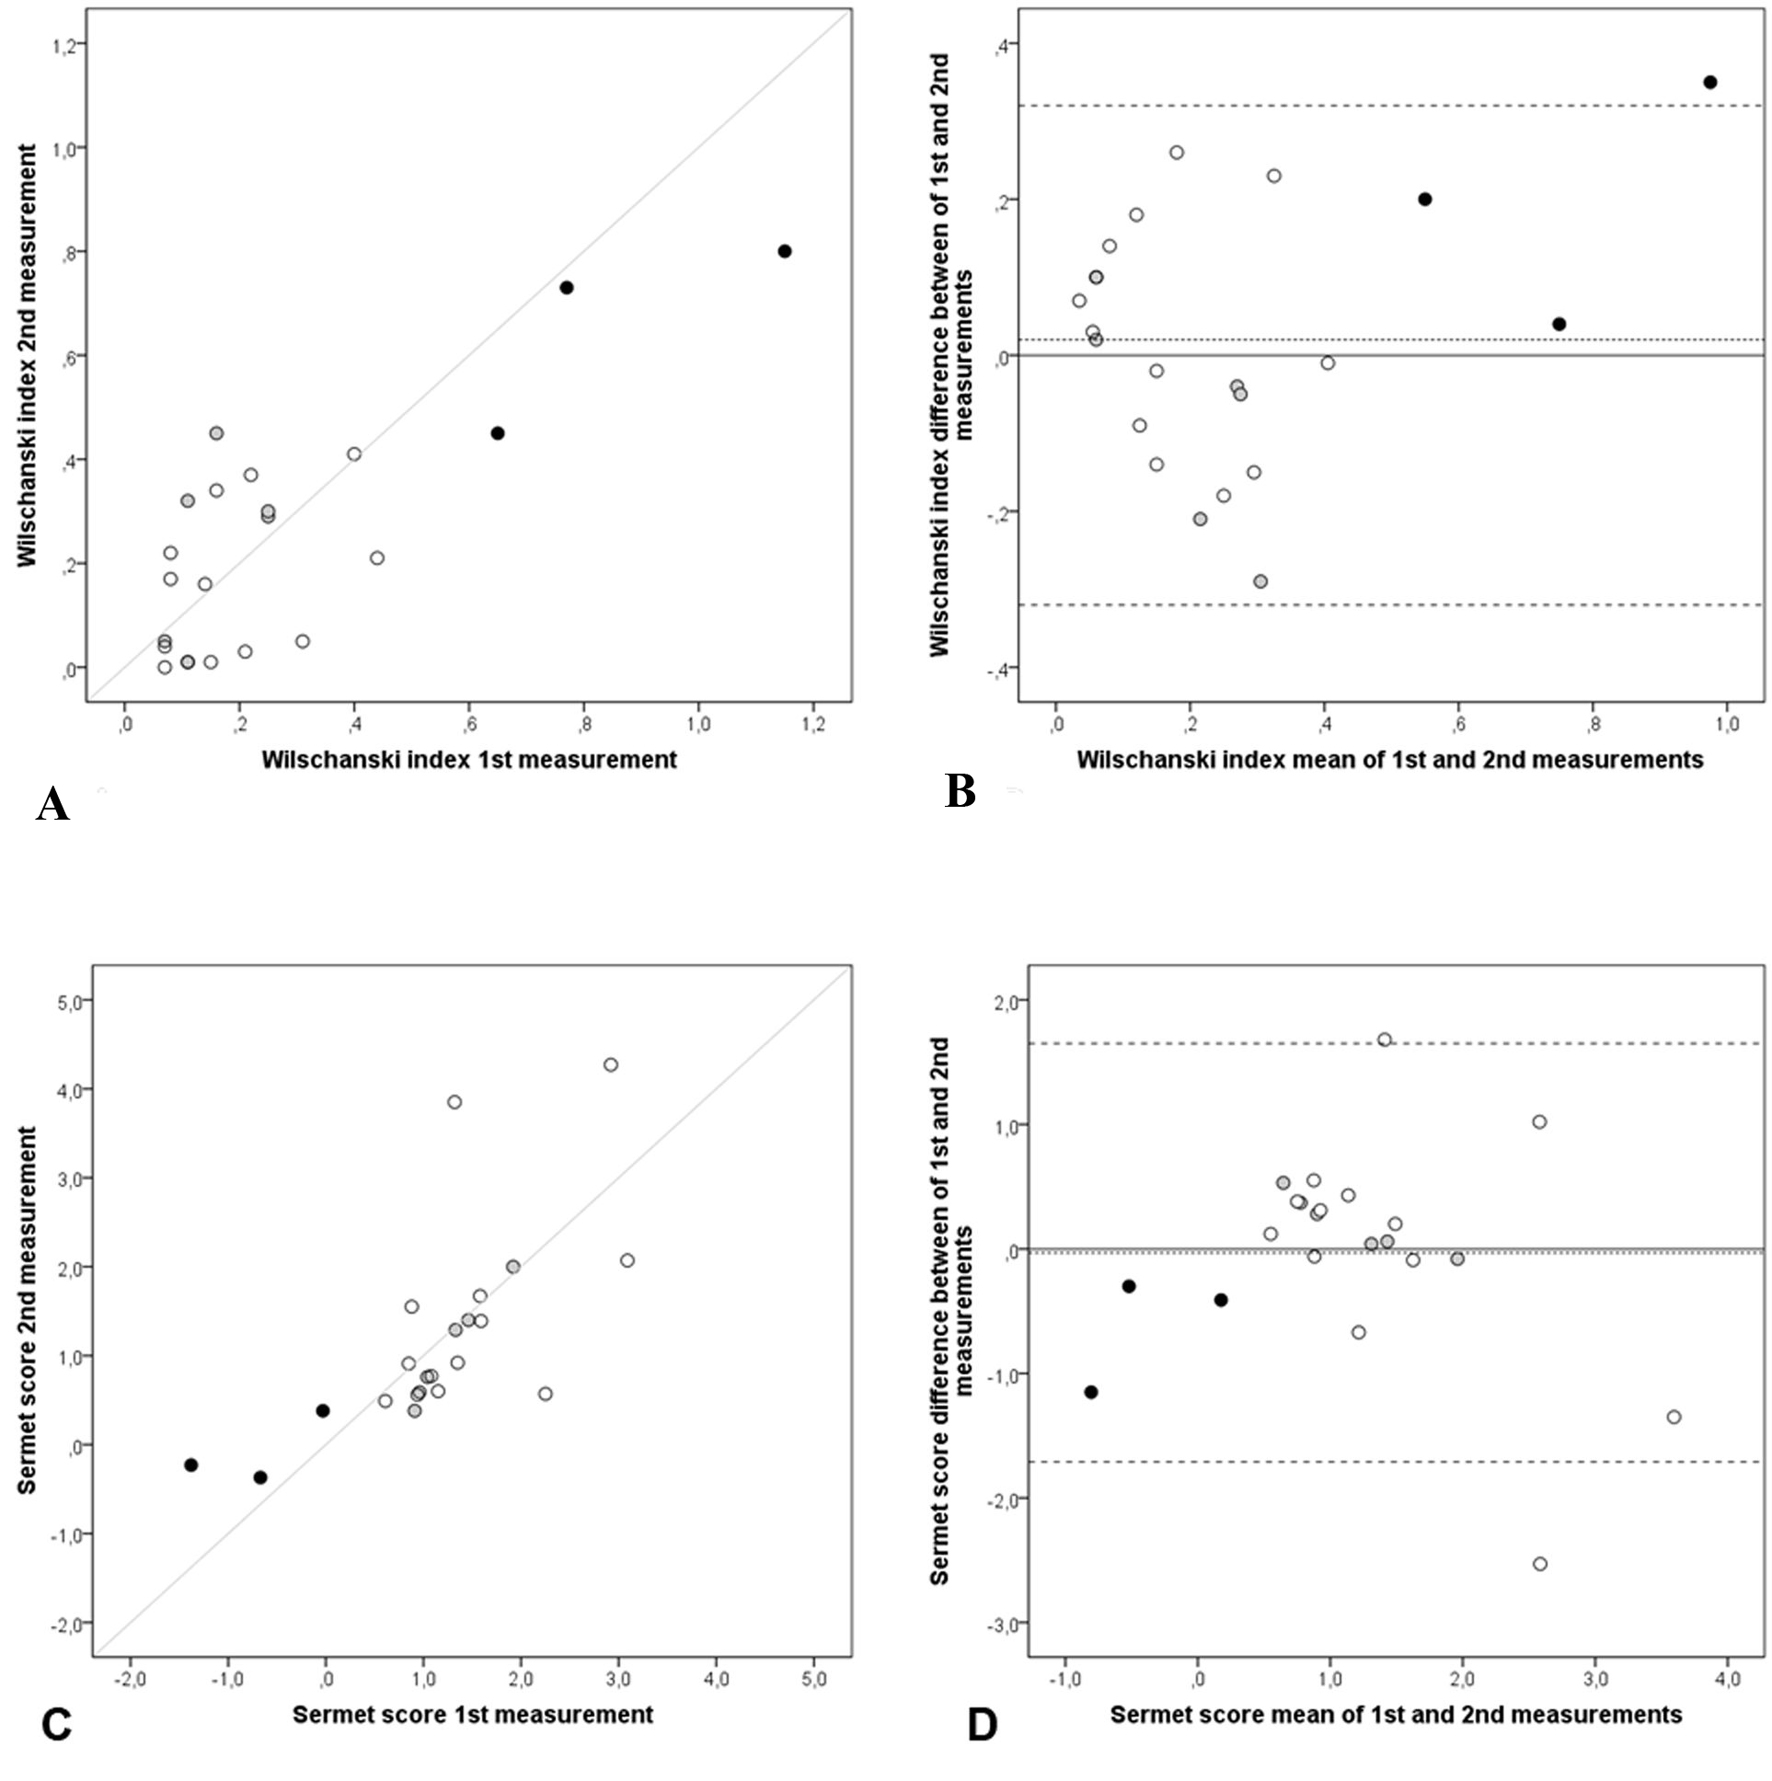
| aPDmax: maximal basal PD; bΔamil: change in PD after amiloride solution infusion; cTCR: change in PD after zero chloride and isoproterenol solutions infusions; dWilschanski index = eTCR/Δamil; eSermet score = -(0.11 × TCR) - (0.05 × Δamil). | |||||
| CF patients (11) | -31.7 (9.5) (-38.1 to -25.3) | 15 (7.2) (10.2 to 19.8) | -1.5 (5.8) (-5.4 to 2.5) | 0.9 (0.4) (0.7 to 1.2) | -0.6 (0.7) (-1.1 to -0.1) |
| Non-CF patients (19) | -16.4 (6.9) (-19.7 to -13.1) | 7.5 (4.2) (5.5 to 9.5) | -15.3 (5.7) (-18.0 to -12.5) | 0.1 (0.1) (0.1 to 0.2) | 1.3 (0.6) (1.0 to 1.6) |
| Healthy-volunteers (48) | -15.2 (7.6) (-17.4 to -13.0) | 7.8 (4.7) (6.5 to 9.2) | -13.0 (6.7) (-15 to -11.1) | 0.2 (0.2) (0.2 to 0.3) | 1.0 (0.7) (0.8 to 1.2) |
| One way ANOVA (P-value) | 0.000 | 0.000 | 0.000 | 0.000 | 0.000 |
| Pair-wise comparison | Post hoc Scheffe (P-value) | ||||
| CF × non-CF | 0.000 | 0.001 | 0.000 | 0.000 | 0.000 |
| CF × healthy-volunteers | 0.000 | 0.000 | 0.000 | 0.000 | 0.000 |
| Non-CF × healthy-volunteers | 0.851 | 0.967 | 0.435 | 0.558 | 0.359 |
| Sex | Diagnostic data | Disease status | NPD parameters and diagnostic indices | |||||||||
|---|---|---|---|---|---|---|---|---|---|---|---|---|
| Age at diagnosis (months) | Sweat Cla (mmol/L) | Genotypeb | Class | FEV1c (% pred) | Chronic Pad | PDmaxe (mV) | Δamilf (mV) | TCRg (mV) | Wilschanski indexh | Sermet scorei | ||
| aQPIT sweat test; bNI: not identified; cFEV1 = forced expiratory volume in the first second; dPa: Pseudomonas aeruginosa; ePDmax = maximum PD after Ringer’s solution perfusion; fΔamil = PD changes after amiloride solution perfusion; gTCR (total chloride response) = PD changes after perfusion with zero Cl- and isoproterenol solutions; hWilschanski index: CF if > 0.7; iSermet score: CF if ≤ 0.27. | ||||||||||||
| 1 | M | 2 | 100.7 | F508del/F508del | II/II | 81.4 | No | -47 | 16 | 11 | 1.84 | -2.11 |
| 2 | F | 4 | 96.0 | F508del/F508del | II/II | 76.7 | Yes | -20 | 6 | -5 | 0.43 | 0.25 |
| 3 | M | 9 | 82.5 | F508del/F508del | II/II | 103.0 | Yes | -25 | 7 | -1 | 0.87 | -0.24 |
| 4 | F | 5 | 88.5 | F508del/F508del | II/II | 77.4 | Yes | -30 | 16 | -7 | 0.65 | -0.03 |
| 5 | M | 80 | 78.6 | F508del/F508del | II/II | 50.7 | Yes | -34 | 11 | -7 | 0.53 | 0.22 |
| 6 | M | 14 | 59.0 | F508del/W1282X | II/I | 116.2 | No | -29 | 15 | 4 | 1.31 | -1.19 |
| 7 | F | 3 | 98.0 | N1303K/G542X | II/I | 45.8 | Yes | -39 | 11 | -2 | 0.83 | -0.33 |
| 8 | M | 72 | 55.3 | S4X/R334W | I/IV or V | 124.0 | No | -37 | 25 | -8 | 0.73 | -0.37 |
| 9 | M | 86 | 79.3 | F508del/NI | II/- | 64.9 | Yes | -15 | 10 | 1 | 1.11 | -0.61 |
| 10 | M | 144 | 52.9 | F508del/NI | II/- | 98.3 | Yes | -40 | 21 | 3 | 1.15 | -1.38 |
| 11 | F | 33 | 77.4 | P205S/NI | IV/- | 64.0 | No | -30 | 19 | -5 | 0.77 | -0.40 |