Figures
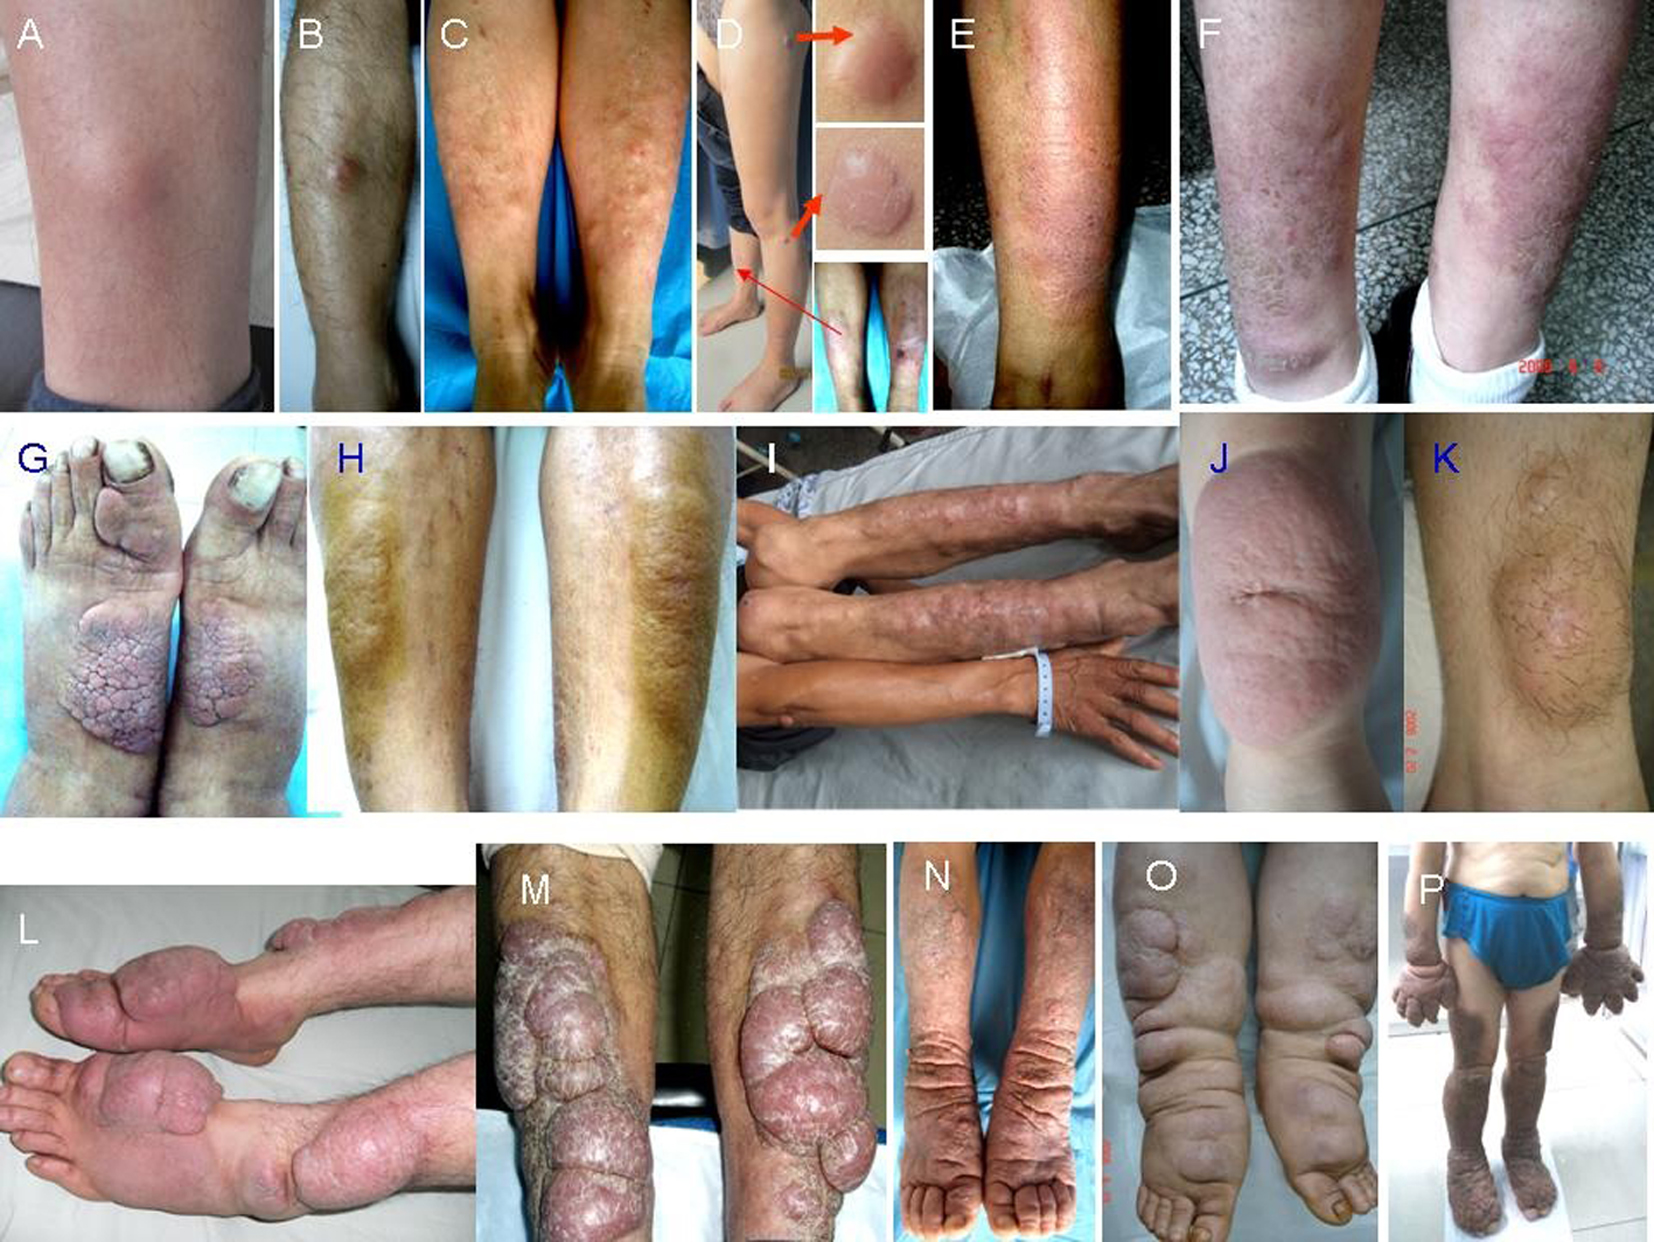
Figure 1. Morphology of PTM variants. Nodules: single erythema and nodule at the unilateral pretibial region (A, B), multiple erythema and nodules at bilateral pretibial regions (C), red nodules at the scar sites (D); diffuse swelling: erythema and non-pitting swelling at the unilateral extensor of a lower leg (E), erythema and non-pitting swelling at bilateral extensors of lower legs (F); plaques: plaques with papillary and polypoid appearance at bilateral dorsa of feet and a toe (G), plaques with peau d’orange appearance at bilateral extensors of lower legs (H); mixtures: single nodule at left elbow and multiple nodules and plaques at bilateral extensors of lower legs (I); giant plaques: a single red plaque with significant protrusion above the normal skin and infiltrate into subcutaneous tissue at the unilateral extensor of a lower leg (J), a giant plaque with hypertrichosis hair and infiltrate into adipose (K); tumors: multiple ball-like red tumors at bilateral extensors of lower legs and dorsa of feet and toes (L), lobulated ball-like tumors with scales and tension appearance at bilateral extensors of lower legs (M); elephantiasis: extensive, indurated, non-pitting swelling and infiltration with peau d’orange appearance of multiple waxy nodules and plaques and hyperpigmentation from lower legs to feet and toes on both lower legs (N), extensive, indurated, non-pitting swelling and infiltration with multiple waxy nodules and plaques from lower legs to feet and toes (O), extensive, indurated, non-pitting swelling and infiltration with papillary and polypoid appearance and hyperpigmentation from one-third of upper legs to feet and toes on both lower extremities and from half of forearms to hands and fingers on both upper extremities (P).
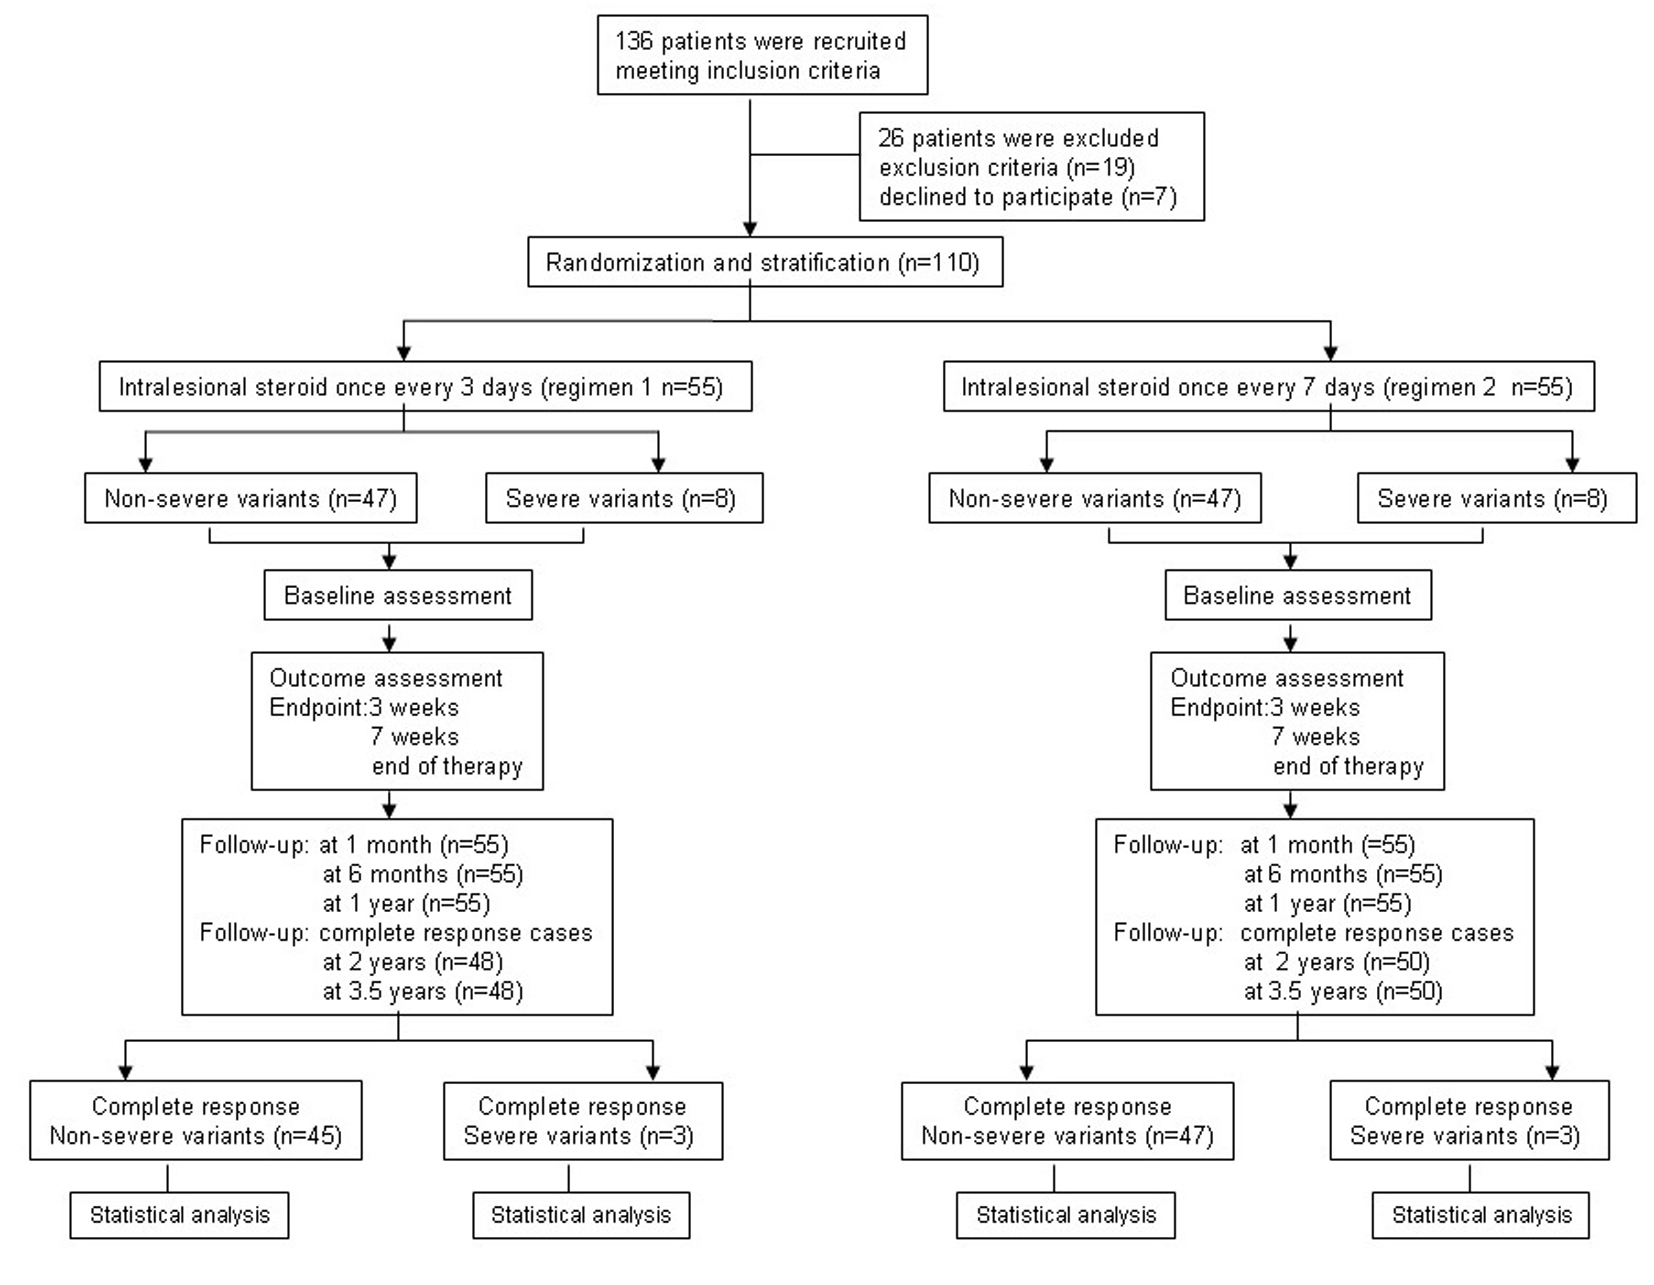
Figure 2. Flowchart of the trial process.
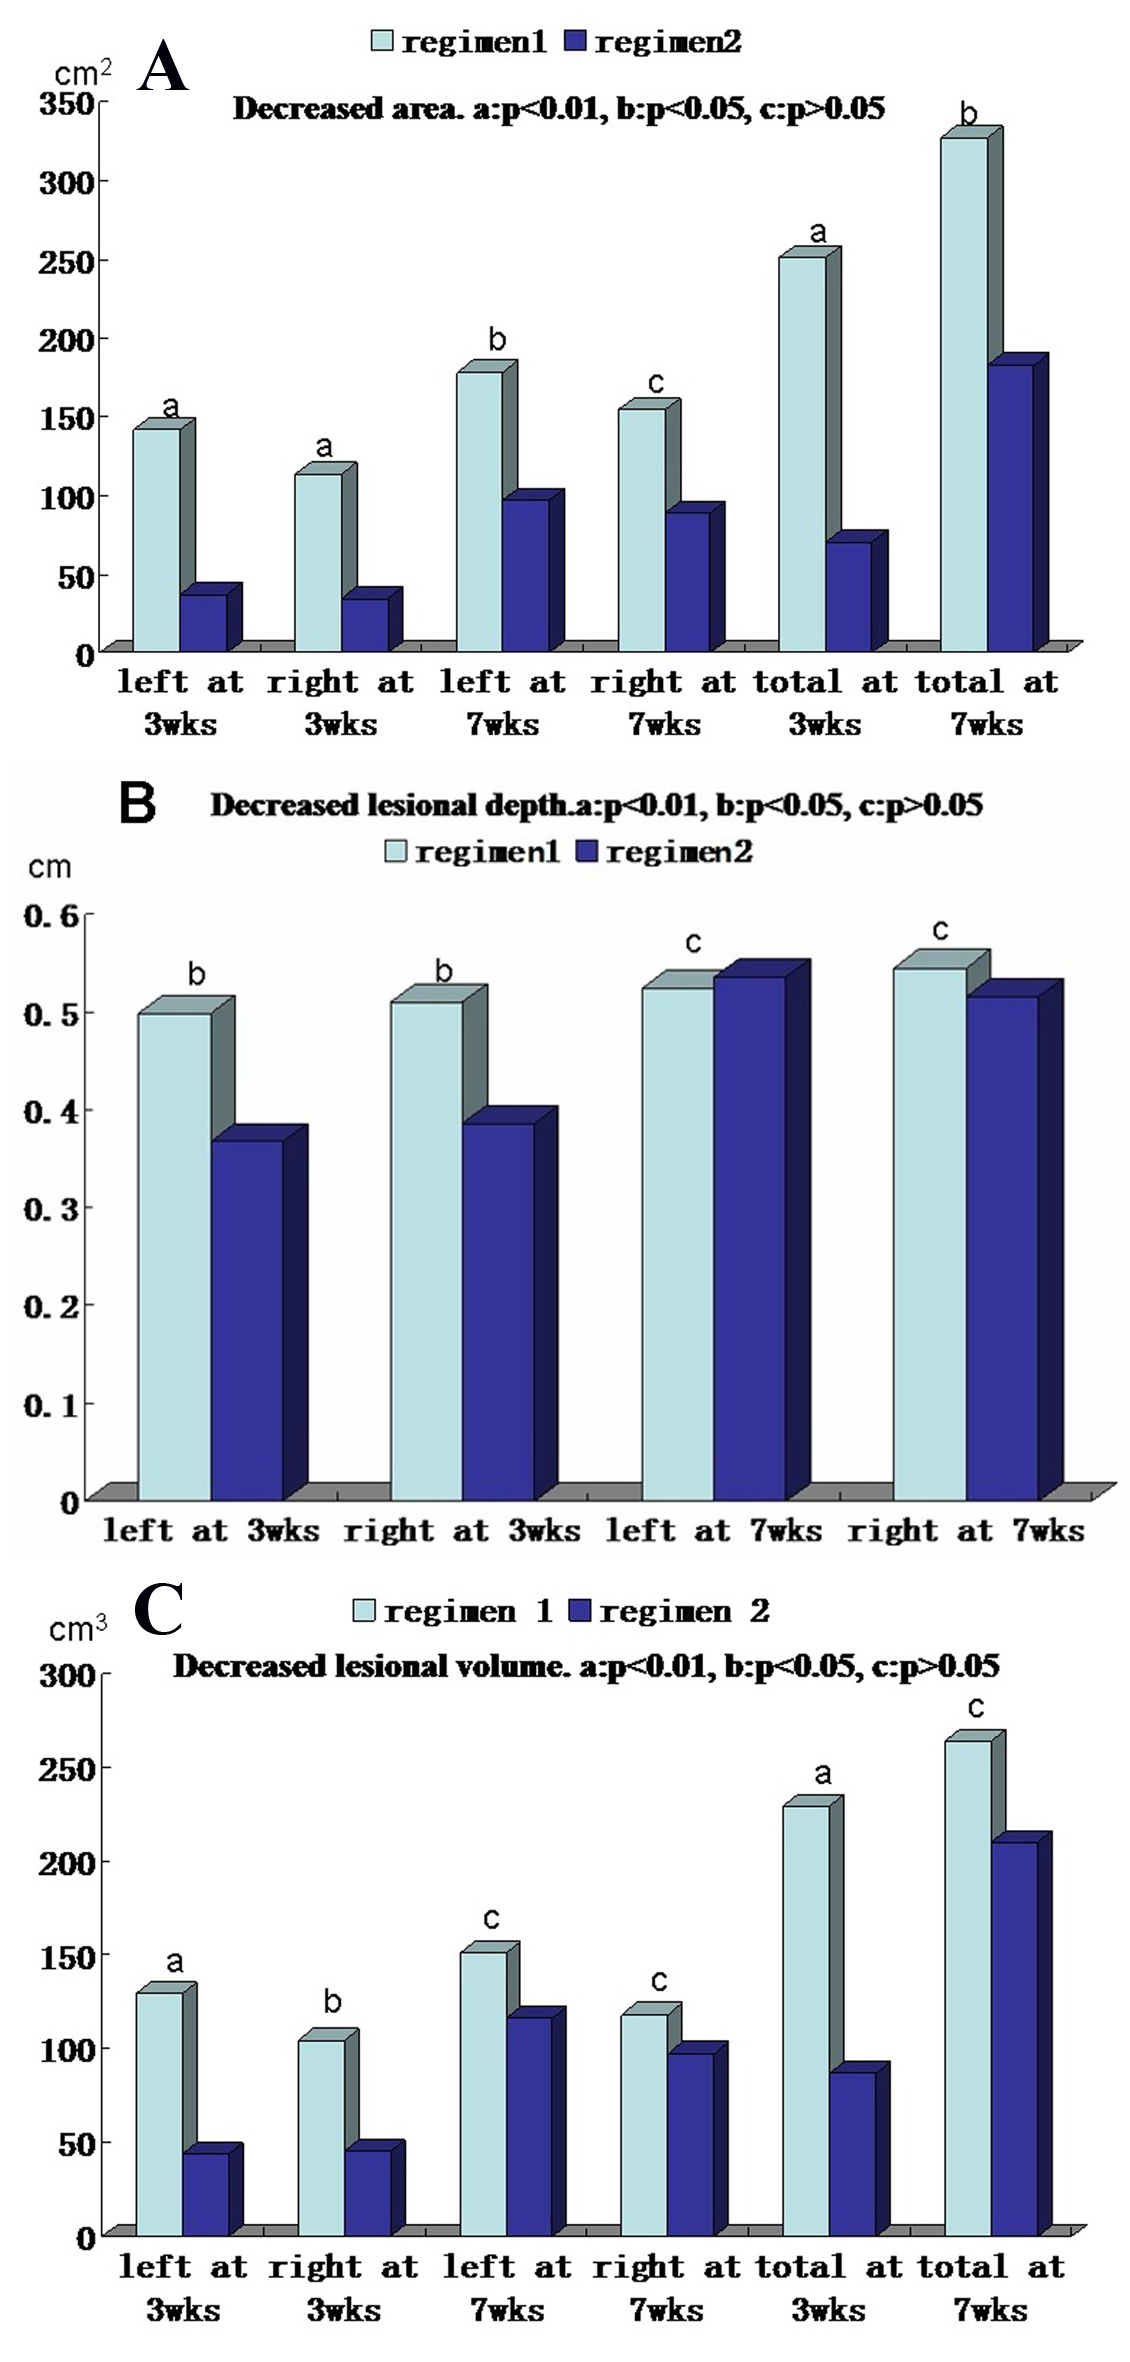
Figure 3. Comparison of decreased area, thickness and volume of pretibial myxedema lesions at 3 and 7 weeks after therapy between regimens 1 and 2. (A) Decreased lesional areas of left side, right side and both sides (total) at 3 weeks and 7 weeks after therapy between two regimens. (B) Decreased lesional depth of left side and right side at 3 weeks and 7 weeks after therapy between two regimens. (C) Decreased lesional volume of left side, right side and both sides (total) at 3 weeks and 7 weeks after therapy between two regimens. In the A, B and C column diagram, “a” is significant difference between two regimens (P < 0.01), “b” is statistical difference between two regimens (P < 0.05) and “c” is no difference between two regimens (P > 0.05).
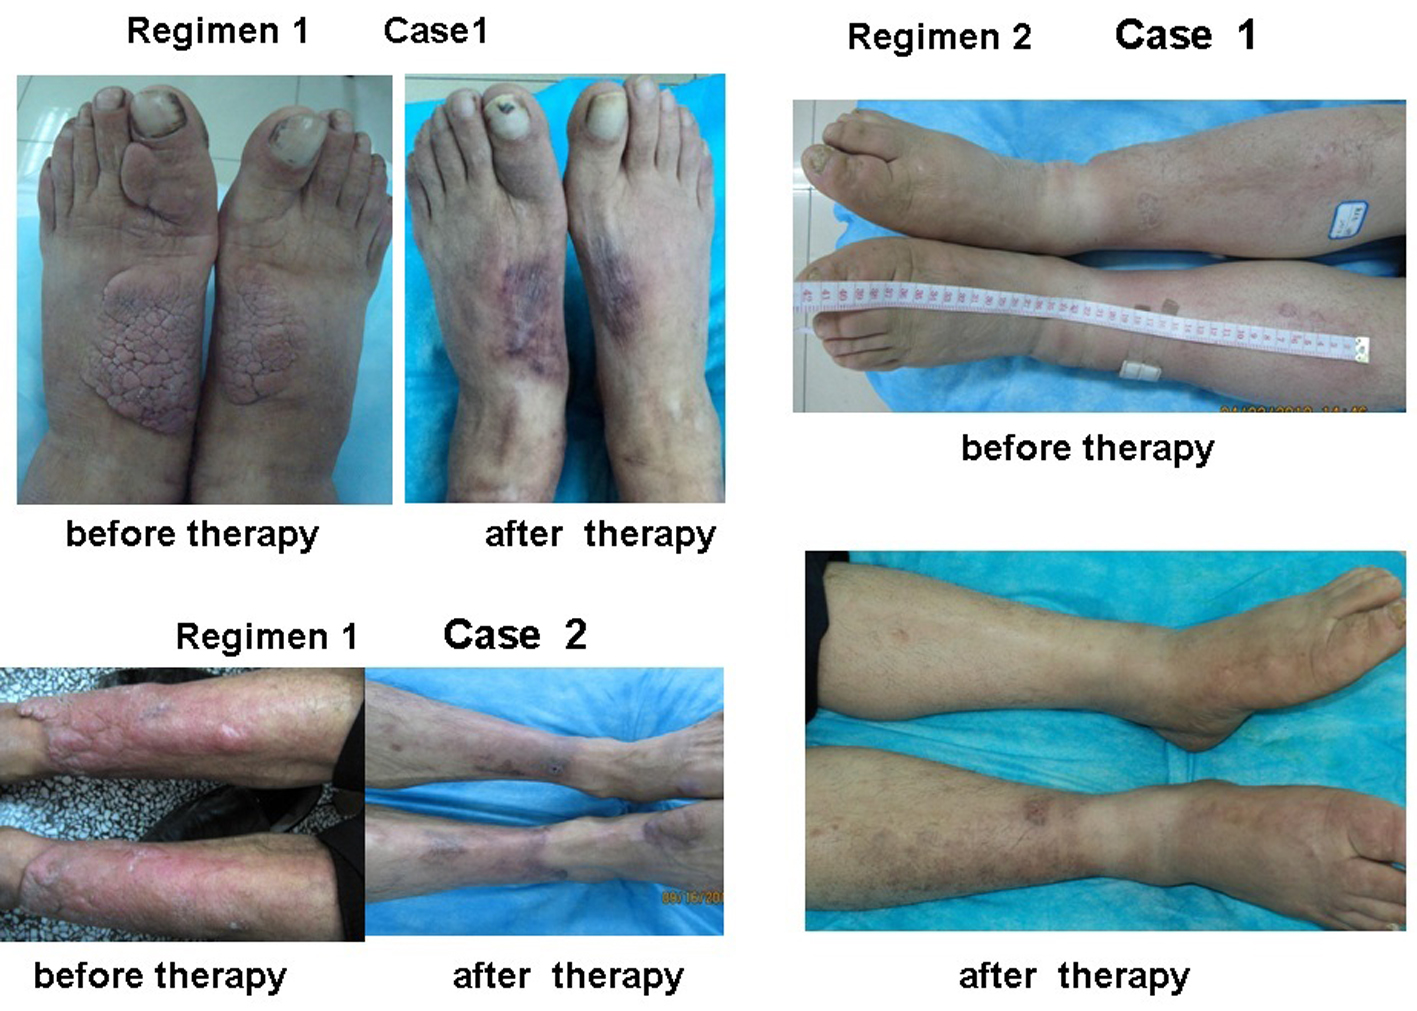
Figure 4. Plaque and diffuse swelling variants of PTM before and after therapy in regimens 1 and 2. Regimen 1 case 1 showed a case with PTM plaques on the dorsum of feet and first toes before and after therapy in regimen 1. Before therapy, erythematous, indurated, non-pitting, verrucous plaques were located on the dorsum of feet and first toes. After therapy, the plaques disappeared and remained erythema and pigmentation. Regimen 1 case 2 showed a case with erythematous plaques and nodules at the extensors of lower legs before and after therapy in regimen 1. Before therapy, erythematous, indurated, non-pitting plaques with nodules were located at the major area of lower leg extensors. After therapy, the plaques and nodules disappeared and remained pigmentation. Regimen 2 case 1 showed a case with diffuse swelling of lower legs and feet. Before therapy, the lower legs and feet were diffuse swelling. After therapy, diffuse swelling disappeared and remained mild pigmentation at the left lower leg.
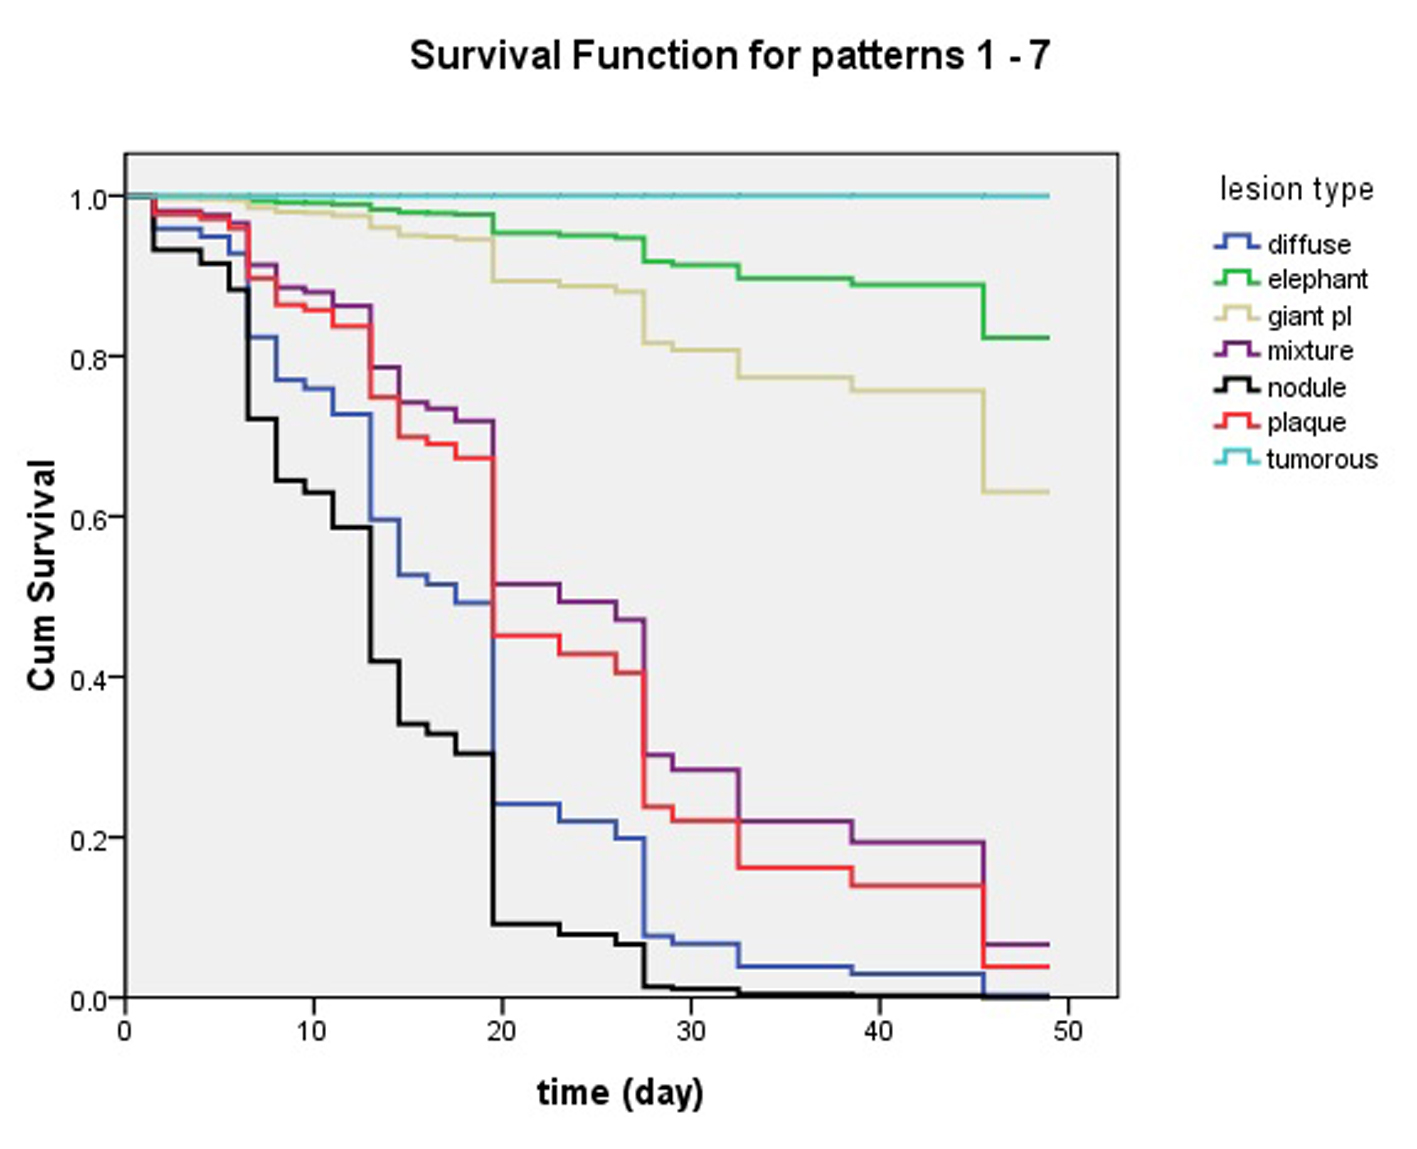
Figure 5. Influence of pretibial myxedema variants in clinical effects of intralesional steroid treating pretibial myxedema analyzed by Cox’s proportional hazards regression model. At 7 week, lesions of patients with nodule and diffuse swelling variants had disappeared and they had obtained 100% complete response. The patients with plaque and mixture variants had more than 90% complete response. The four variants of pretibial myxedema had excellent response to the therapy of intralesional steroid. However, less than 40% of the patients with giant plaque had complete response and more than 60% of them had no complete response. What’s worse, the elephantiasis variant had less than 20% of complete response and the tumorous variant had no complete response.
Tables
Table 1. Demographic and Clinical Characteristic of Participants at Baseline
| Characteristic value | Regimen 1 analysis (N = 55) | Regimen 2 (N = 55) | Statistical test | P |
|---|
| Age (mean ± SD), years | 44.65 ± 11.47 | 40.73 ± 12.24 | t = 1.736 | 0.085 |
| Range (min - max) | 18 - 77 | 17 - 65 | | |
| Sex ratio (male/female) | 0.83 (25/30) | 0.83 (25/30) | χ2 =0.00 | 1.00 |
| Occupation | | | χ2=0.345 | 0.951 |
| Chinese farmer | 42 | 41 | | |
| Worker | 1 | 2 | | |
| Cadre | 2 | 2 | | |
| City dweller | 10 | 10 | | |
| Course (mean ± SD), months | 22.25 ± 24.19 | 21.69 ± 23.88 | t = 0.123 | 0.902 |
| Range (min - max) | 1 - 120 | 1 - 120 | | |
| Numbers of lesions | 2.87 ± 2.64 | 2.42 ± 1.20 | t = 1.163 | 0.247 |
| Types of lesion | | | | |
| Nodule | 8 | 13 | | |
| Plaque | 6 | 5 | | |
| Diffuse swelling | 24 | 25 | | |
| Mixture | 9 | 4 | χ2 = 8.648 | 0.335 |
| Giant plaque | 3 | 3 | | |
| Tumorous | 1 | 1 | | |
| Elephantiasis | 4 | 4 | | |
| Distribution of lesion | | | | |
| Both lower legs | 42 | 48 | | |
| Both lower legs and feet | 6 | 5 | | |
| Both lower legs and right hand | 1 | 0 | | |
| Both lower legs and left toes | 1 | 0 | χ2 = 6.824 | 0.447 |
| Both lower legs and left foot | 1 | 0 | | |
| Dorsum of feet | 2 | 0 | | |
| Right lower leg | 1 | 0 | | |
| Left lower leg | 1 | 2 | | |
| Stage of lesion | | | | |
| Active/stable | 36/19 | 36/19 | χ2 = 0.000 | 1.00 |
Table 2. Comparison of Area, Thickness and Volume of PTM Lesions Between Before and After Therapy
| Before therapy (mean ± SD) | After therapy | Paired samples t-test |
|---|
| At 3 weeks (mean ± SD) | At 7 weeks (mean ± SD) | Before and at 3 weeks t value | P value | Before and at 7 weeks t value | P value | At 3 weeks and at 7 weeks t value | P value |
|---|
| Left area (cm2) | | | | | | | | |
| Regimen 1 (N = 54) | 255.2 ± 381.4 | 113.5 ± 247.8 | 77.1 ± 219.4 | 4.818 | 0.000 | 5.308 | 0.000 | 2.704 | 0.009 |
| Regimen 2 (N = 55) | 172.1 ± 360.7 | 134.7 ± 352.1 | 75.2 ± 264.0 | 5.363 | 0.000 | 5.85 | 0.000 | 4.088 | 0.000 |
| Right area (cm2) | | | | | | | | |
| Regimen 1 (N = 54) | 221.6 ± 336.2 | 108.2 ± 220.2 | 67.4 ± 189.8 | 4.374 | 0.000 | 4.915 | 0.000 | 3.116 | 0.003 |
| Regimen 2 (N = 53) | 151.7 ± 297.6 | 117.0 ± 282.0 | 62.9 ± 210.8 | 4.003 | 0.000 | 5.79 | 0.000 | 4.165 | 0.000 |
| Both side area (cm2) | | | | | | | | |
| Regimen 1 (N = 55) | 468.7 ± 707.7 | 217.7 ± 461.2 | 141.9 ± 403.4 | 4.718 | 0.000 | 5.159 | 0.000 | 2.938 | 0.005 |
| Regimen 2 (N = 55) | 318.3 ± 646.9 | 247.5 ± 624.3 | 135.8 ± 461.8 | 5.014 | 0.000 | 5.968 | 0.000 | 4.173 | 0.000 |
| Left skin depth (cm) | | | | | | | | |
| Regimen 1 (N = 54) | 0.739 ± 0.468 | 0.241 ± 0.337 | 0.216 ± 0.303 | 12.211 | 0.000 | 12.695 | 0.000 | 2.147 | 0.036 |
| Regimen 2 (N = 55) | 0.734 ± 0.340 | 0.367 ± 0.396 | 0.199 ± 0.244 | 11.618 | 0.000 | 15.052 | 0.000 | 4.914 | 0.000 |
| Right skin depth (cm) | | | | | | | | |
| Regimen 1 (N = 54) | 0.764 ± 0.445 | 0.254 ± 0.354 | 0.218 ± 0.297 | 12.939 | 0.000 | 13.736 | 0.000 | 3.02 | 0.004 |
| Regimen 2 (N = 53) | 0.716 ± 0.306 | 0.333 ± 0.354 | 0.203 ± 0.241 | 11.426 | 0.000 | 15.676 | 0.000 | 4.354 | 0.000 |
| Left lesion depth (cm) | | | | | | | | |
| Regimen 1 (N = 54) | 0.619 ± 0.469 | 0.120 ± 0.337 | 0.095 ± 0.303 | 12.223 | 0.000 | 12.695 | 0.000 | 2.133 | 0.038 |
| Regimen 2 (N = 55) | 0.617 ± 0.339 | 0.250 ± 0.396 | 0.082 ± 0.243 | 11.635 | 0.000 | 15.067 | 0.000 | 4.902 | 0.000 |
| Right lesion depth (cm) | | | | | | | | |
| Regimen 1 (N = 54) | 0.641 ± 0.447 | 0.13 ± 0.354 | 0.096 ± 0.297 | 12.852 | 0.000 | 13.659 | 0.000 | 3.02 | 0.004 |
| Regimen 2 (N = 53) | 0.598 ± 0.307 | 0.2123 ± 0.356 | 0.083 ± 0.241 | 11.408 | 0.000 | 15.662 | 0.000 | 4.334 | 0.000 |
| Left volume (cm3) | | | | | | | | |
| Regimen 1 (N = 54) | 191.1 ± 433.3 | 61.9 ± 254.2 | 40.1 ± 203.1 | 4.517 | 0.000 | 3.946 | 0.000 | 1.478 | 0.145 |
| Regimen 2 (N = 55) | 176.4 ± 484.7 | 132.8 ± 455.5 | 60.1 ± 237.7 | 4.197 | 0.000 | 3.398 | 0.001 | 2.409 | 0.019 |
| Right volume (cm3) | | | | | | | | |
| Regimen 1 (N = 54) | 165.4 ± 375.7 | 61.2 ± 259.1 | 47.3 ± 210.6 | 5.196 | 0.000 | 4.64 | 0.000 | -1.65 | 0.105 |
| Regimen 2 (N = 53) | 142.5 ± 355.0 | 97.5 ± 300.8 | 45.3 ± 174.3 | 3.533 | 0.001 | 3.708 | 0.001 | 2.727 | 0.009 |
| Both side volume (cm3) | | | | | | | | |
| Regimen 1 (N = 55) | 350.0 ± 798.9 | 120.9 ± 508.3 | 85.9 ± 403.7 | 4.848 | 0.000 | 4.27 | 0.000 | 1.682 | 0.098 |
| Regimen 2 (N = 55) | 313.7 ± 824.5 | 226.8 ± 744.6 | 103.8 ± 402.9 | 3.914 | 0.000 | 3.571 | 0.001 | 2.554 | 0.013 |
Table 3. Comparison of Efficacy and Safety of Intralesional Steroid Treating PTM Between Regimens 1 and 2
| Regimen 1 (N = 55) | Regimen 2 (N = 55) | Statistical analysis |
|---|
| Intralesional steroid once every 3 days | Intralesional steroid once every 7 days | Test | P value |
|---|
| Efficacy | | | | |
| At 3 weeks after therapy began | | | | |
| Complete response | 43 (78.2%) | 28 (50.9%) | χ2 = 8.422 | 0.038 |
| Major response | 8 | 14 |
| Partial response | 2 | 6 |
| No response | 2 | 7 |
| At 7 weeks after therapy began | | | | |
| Complete response | 46 (83.6%) | 49 (89.1%) | χ2 = 0.913 | 0.634 |
| Major response | 7 | 4 |
| Partial response | 2 | 2 |
| No response | 0 | 0 |
| At end of therapy | | | | |
| complete response | 48 (87.3%) | 50 (90.9%) | χ2 = 0.441 | 0.802 |
| major response | 6 | 4 |
| partial response | 1 | 1 |
| no response | 0 | 0 |
| Safety | | | | |
| Pain at injection sites, No. (%) | 55 (100%) | 55 (100%) | | |
| Ecchymosis, No. | 3 | 1 | Z = -4.332 | 0.000 |
| Infection, No. | 1 | 1 |
| Fragile skin, No. | 3 | 2 |
| Hyperglycemia, No. | 13 | 7 |
| High blood pressure, No. | 9 | 6 |
| Cushing's syndrome, No. | 12 | 6 |
| Lower limb muscle pain, No. | 2 | 2 |
| Lower limb muscle weakness, No. | 3 | 3 |
| Average adverse reaction except pain, No. (%) | 46/440 (11.7%) | 28/440 (6.4%) | χ2= 4.78 | 0.029 |
| Adverse reaction occurrence time except pain (mean ± SD), days | 17.9 ± 2.9 | 42.6 ± 5.7 | t = -24.554 | 0.000 |
Table 4. Influence of Dosage and Frequency in Clinical Effects of Steroid Treating Pretibial Myxedema
| Complete response at 7 weeks after therapy | Regimen 1 (N = 55) | Regimen 2 (N = 55) | Statistical analysis |
|---|
| Regimen 1 (n = 48), regimen 2 (n = 49) | Intralesional steroid once every 3 days | Intralesional steroid once every 7 days | Test | P value |
|---|
| Clinical effect occurring after injection (days), mean ± SD (min - max) | 2.5 ± 0.6 (1 - 4) | 3.1 ± 0.8 (1 - 7) | t = -4.629 | 0.000 |
| Complete response time at 7 weeks (days), regimen 1 = 46, regimen 2 = 49 | 14.9 ± 7.6 (3 - 30) | 23.9 ± 12.6 (7 - 49) | t = -4.230 | 0.000 |
| Injection number at 7 weeks, regimen 1 = 46, regimen 2 = 49 | 4.2 ± 2.4 (1 - 8) | 3.2 ± 1.7 (1 - 7) | t = 2.343 | 0.021 |
| Dose of steroid at 7 weeks (mg), regimen 1 = 46, regimen 2 = 49 | 254 ± 197 | 140 ± 120 | t = 3.424 | 0.001 |
| Steroid dose/lesion volume at 7 weeks (mg/cm3), regimen 1 = 46, regimen 2 = 49 | 3.6 ± 4 | 3.7 ± 3.6 | t = -0.231 | 0.818 |
| Dose of steroid at end of therapy (mg), regimen 1 = 48, regimen 2 = 50 | 283 ± 240 (16 - 1,050) | 163 ± 203 (11 - 1,300) | t = 2.674 | 0.009 |
| Steroid dose/lesion volume at end of therapy (mg/cm3), regimen 1 = 48, regimen 2 = 50 | 3.5 ± 3.9 | 3.7 ± 3.6 | t = -0.223 | 0.824 |