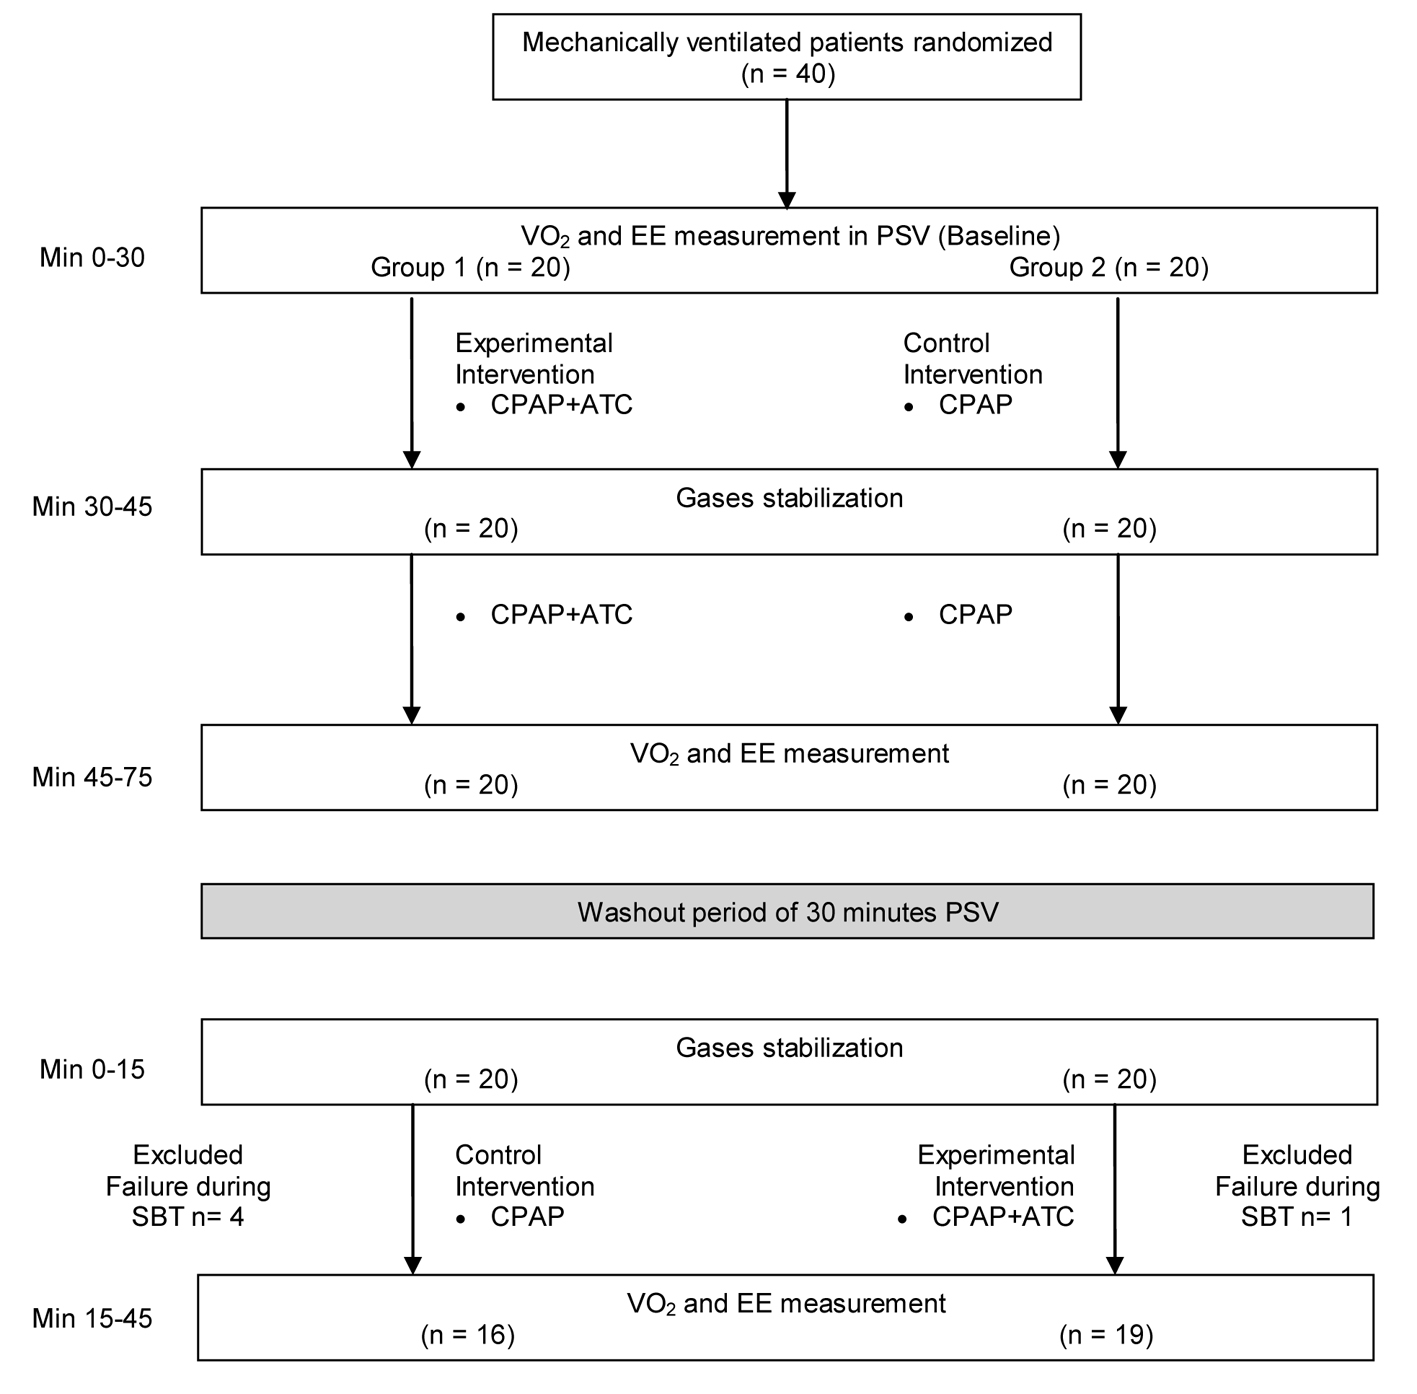
Figure 1. Experimental design used throughout the study.
| Journal of Clinical Medicine Research, ISSN 1918-3003 print, 1918-3011 online, Open Access |
| Article copyright, the authors; Journal compilation copyright, J Clin Med Res and Elmer Press Inc |
| Journal website http://www.jocmr.org |
Original Article
Volume 7, Number 9, September 2015, pages 700-705
Comparison of Energy Expenditure and Oxygen Consumption of Spontaneous Breathing Trial Conducted With and Without Automatic Tube Compensation
Figures
Tables
| Variables | Values |
|---|---|
| SD: standard deviation; APACHE II: Acute Physiology and Chronic Health Evaluation II; SAPS 3: Simplified Acute Physiology Score 3; ICU: intensive care unit; MV: mechanical ventilation; ETT: endotracheal tube or tracheostomy; ARF: acute respiratory failure; COPD: chronic obstructive pulmonary disease. | |
| Gender | |
| Male, n (%) | 18 (51) |
| Female, n (%) | 17 (49) |
| Age (years) (mean ± SD) | 61.4 ± 16.1 |
| APACHE II (mean ± SD) | 24.6 ± 8.4 |
| SAPS 3 (mean ± SD) | 67.7 ± 22 |
| ICU mortality, n (%) | 6 (15) |
| Hospital mortality, n (%) | 17 (42.5) |
| Length of ICU stay (mean ± SD) | 14.1 ± 8.2 |
| Length of hospital stay (mean ± SD) | 78 ± 70.71 |
| Airway resistance at baseline (cm H2O/L/s) | 9.02 ± 2.35 |
| ETT size (mm) | 7.85 ± 0.49 |
| Reason to initiate MV | |
| ARF, n (%) | 24 (68%) |
| Septic shock, n (%) | 7 (20%) |
| COPD, n (%) | 2 (6%) |
| Hepatic encephalopathy, n (%) | 1 (3%) |
| Cerebrovascular accident, n (%) | 1 (3%) |
| Cause of ARF | |
| Pneumonia, n (%) | 11 (46%) |
| Post-operative, n (%) | 7 (29%) |
| Acute pulmonary edema, n (%) | 3 (12.5%) |
| Sepsis, n (%) | 2 (8.4%) |
| Cardiac arrest, n (%) | 1 (4.1%) |
| Diagnosis upon admission | |
| Septic shock, n (%) | 11 (31%) |
| Respiratory, n (%) | 11 (31%) |
| Post-operative, n (%) | 9 (26%) |
| Cerebrovascular accident, n (%) | 1 (3%) |
| Others, n (%) | 3 (9) |
| Variables | Estimated value T1-T2 | 95% confidence interval | P value | Estimated value G1-G2 | 95% confidence interval | P value | Estimated value P1-P2 | 95% confidence interval | P value |
|---|---|---|---|---|---|---|---|---|---|
| T1: treatment 1 with ATC; T2: treatment 2 without ATC; G1: group 1; G2: group 2; P1: period 1; P2: period 2; VO2: oxygen consumption; EE: energy expenditure; VCO2: carbon dioxide production; RQ: respiratory quotient; Vt: tidal volume; Rr: respiratory rate; RSBI: rapid shallow breathing index; P0.1: airway occlusion pressure 100 ms after onset of inspiratory flow; HR: heart rate; MAP: mean arterial pressure; SPO2: peripheral oxygen saturation. | |||||||||
| VO2 (mL/kg/min) | -1.6 | -4.36 to 1.07 | 0.23 | 5.4 | -26.44 to 37.43 | 0.73 | -3.5 | -6.25 to -0.82 | 0.01 |
| EE (kcal/day) | -5.4 | -21.67 to 10.79 | 0.500 | 34.0 | -163.79 to 231.93 | 0.728 | -22.8 | -39.04 to -6.58 | 0.007 |
| VCO2 (mL/kg/min) | 0.3 | -2.49 to 3.11 | 0.82 | 2.1 | -15.30 to 19.64 | 0.82 | 1.0 | -3.86 to 1.74 | 0.45 |
| RQ | 0.004 | -0.01 to 0.02 | 0.63 | -0.007 | -0.11 to 0.09 | 0.88 | 0.023 | 0 to 0.04 | 0.02 |
| Peak pressure (cm H2O) | 2.00 | 1.39 to 2.62 | 0.0001 | 0.55 | -0.93 to 2.03 | 0.4555 | 0.35 | -0.25 to 0.97 | 0.2446 |
| Vt (mL) | 13.32 | -30.65 to 57.30 | 0.5415 | 24.20 | -89.14 to 137.56 | 0.6668 | 17.27 | -26.70 to 61.24 | 0.4296 |
| Rr (bpm) | 0.34 | -0.87 to 1.56 | 0.5688 | 1.26 | -2.49 to 5.02 | 0.4993 | -0.76 | -1.98 to 0.44 | 0.2080 |
| RSBI (bpm/L) | 1.17 | -4.11 to 6.46 | 0.6531 | 8.99 | -28.32 to 46.31 | 0.6268 | -3.77 | -9.06 to 1.51 | 0.1558 |
| P0.1 (cm H2O) | -0.49 | -0.84 to -0.14 | 0.0073 | 0.14 | -1.21 to 1.50 | 0.8276 | -0.39 | -0.75 to -0.04 | 0.0279 |
| HR (beats per min) | -1.84 | -3.65 to -0.048 | 0.0445 | -1.38 | -9.25 to 12.02 | 0.7921 | -1.41 | -3.22 to 12.02 | 0.1176 |
| MAP (mm Hg) | -0.57 | -3.14 to 2.00 | 0.6526 | -7.74 | -16.89 to 1.40 | 0.0942 | 0.57 | -16.89 to 1.40 | 0.6510 |
| SpO2 (%) | -0.11 | -0.64 to 0.41 | 0.6644 | -0.63 | -1.98 to 0.71 | 0.3416 | 0.26 | -0.27 to 0.79 | 0.3235 |