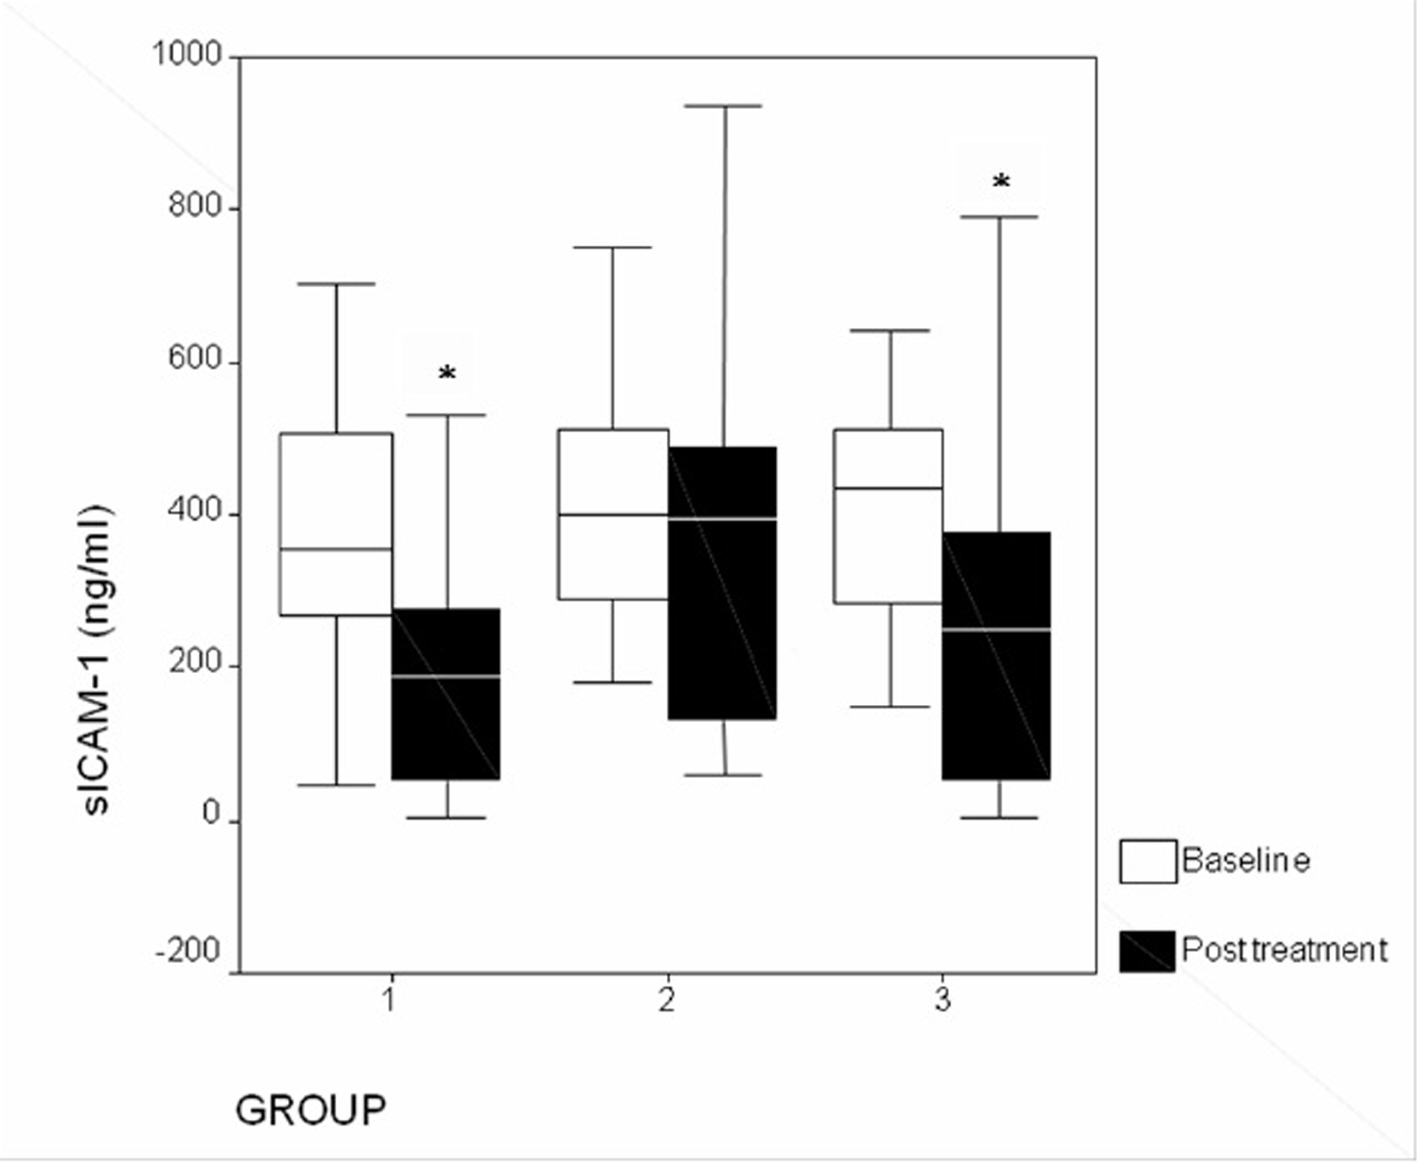
Figure 1. Changes in plasma sICAM-1 levels after treatment (*P < 0.05). Group 1: atorvastatin; group 2: pioglitazone; group 3: atorvastatin + pioglitazone.
| Journal of Clinical Medicine Research, ISSN 1918-3003 print, 1918-3011 online, Open Access |
| Article copyright, the authors; Journal compilation copyright, J Clin Med Res and Elmer Press Inc |
| Journal website http://www.jocmr.org |
Original Article
Volume 7, Number 8, August 2015, pages 613-619
Effect of Atorvastatin and Pioglitazone on Plasma Levels of Adhesion Molecules in Non-Diabetic Patients With Hypertension or Stable Angina or Both
Figures
Tables
| Variable | Group 1 | Group 2 | Group 3 |
|---|---|---|---|
| Variables expressed in mean ± SD. SBP: systolic blood pressure; DBP: diastolic blood pressure; FPG: fasting plasma glucose; AST: aspartate aminotransferase; ALT: alanine aminotransferase. | |||
| Number of patients | 14 | 20 | 25 |
| Sex (M/F) | 10/4 | 14/6 | 19/6 |
| Age (years) | 51 ± 7.9 | 50.3 ± 10.0 | 49.8 ± 9.1 |
| FPG (mg/dL) | 89.2 ± 10.6 | 91.2 ± 10.2 | 91.9 ± 11.2 |
| SBP (mm Hg) | 135.8 ± 7.1 | 131.8 ± 10.2 | 130.8 ± 10.9 |
| DBP (mm Hg) | 87.7 ± 5.9 | 86.3 ± 4.6 | 82.9 ± 5.4 |
| Serum AST (IU/L) | 36.2 ± 4.6 | 35.9 ± 4.2 | 36.7 ± 4.8 |
| Serum ALT (IU/L) | 35.7 ± 4.8 | 34.8 ± 3.7 | 35.2 ± 4.3 |
| Blood urea (mg/dL) | 29.7 ± 6.5 | 29 ± 6.4 | 29.1 ± 6.3 |
| Serum creatinine (mg/dL) | 1.07 ± 0.20 | 1.1 ± 0.2 | 1.0 ± 0.2 |
| LDL cholesterol | 105 ± 28 | 110 ± 32 | 98 ± 24 |
| Triglycerides | 144 ± 110 | 152 ± 96 | 140 ± 100 |
| Hypertension without stable angina | 11 | 12 | 9 |
| Stable angina without hypertension | 1 | 5 | 12 |
| Hypertension and stable angina | 2 | 3 | 4 |
| Group 1 (n = 14) | Group 2 (n = 20) | Group 3 (n = 25) | Pa | |||
|---|---|---|---|---|---|---|
| Values are expressed as median (min-max; inter-quartile range). Pa: P-value when base line plasma values of hsCRP, sICAM-1 and sVCAM-1 are compared between the study groups. Pb: P-value when post treatment plasma values of hsCRP, sICAM-1 and sVCAM-1 are compared to their respective baseline values in each treatment group. P-value < 0.05 was considered statistically significant. | ||||||
| Baseline | ||||||
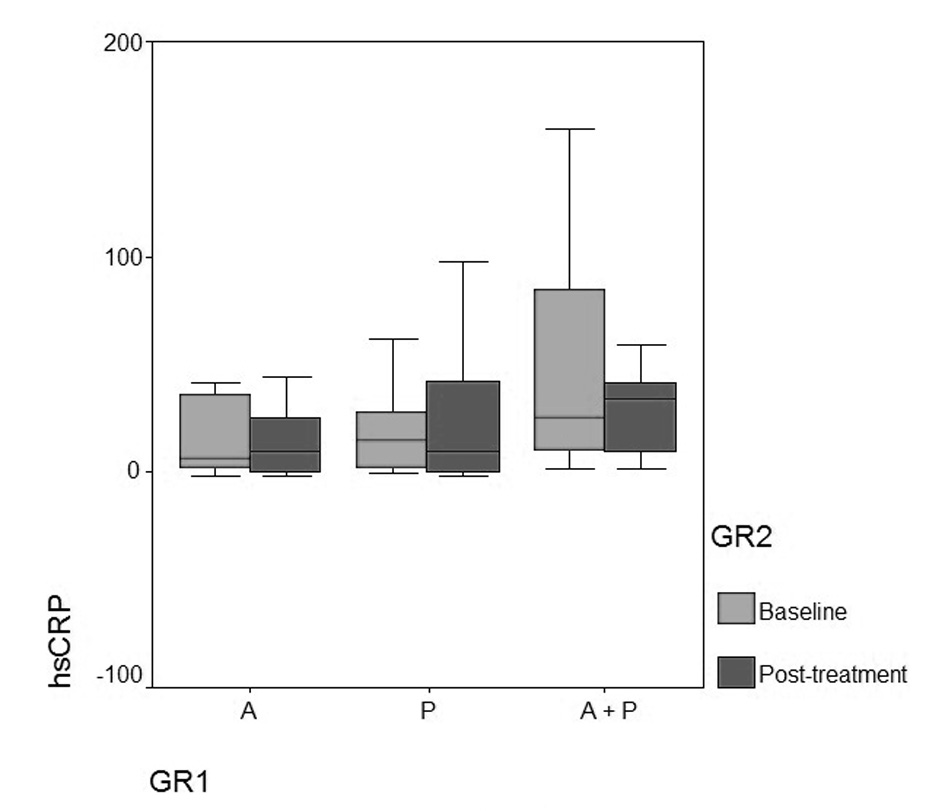
| hsCRP | 0.63 (0.01 - 3.42; 2.07) | 1.91 (0.01 - 5.04; 2.41) | 2.54 (0.18 - 5.05; 2.25) | 0.09 | ||
| sICAM-1 | 357.4 (48.0 - 700.9; 310.4) | 401.7 (182.1 - 751.1; 229.8) | 435.3 (148.8 - 899.6; 240.5) | 0.65 | ||
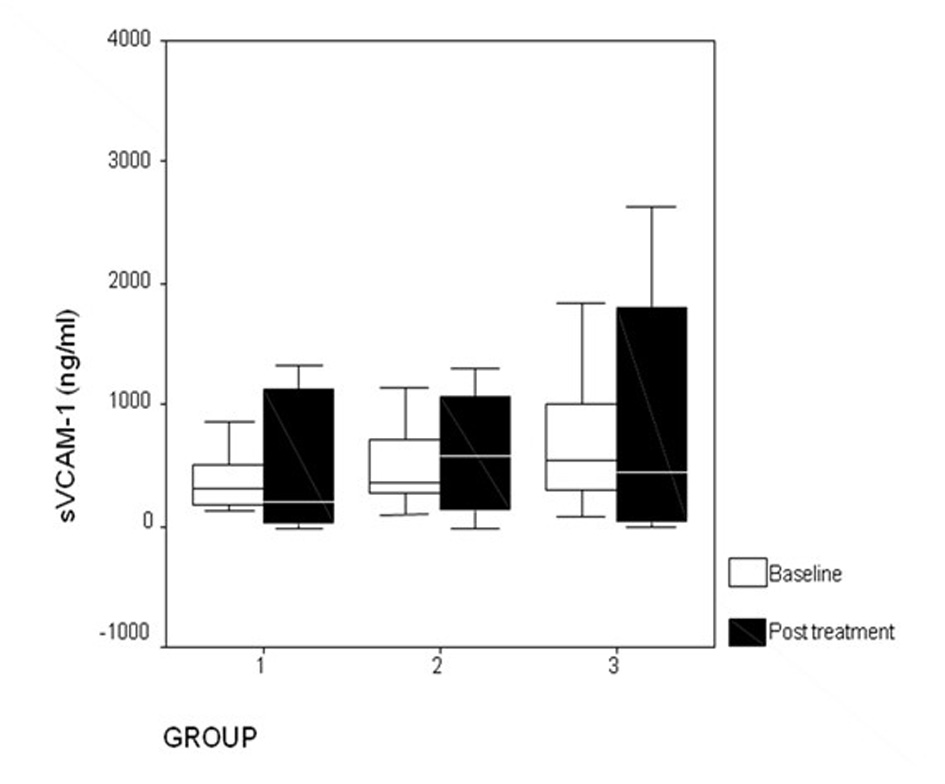
| sVCAM-1 | 314.5 (129.0 - 858.9; 362.9) | 361.0 (96.7 C 1,142.5; 466.8) | 536.3 (76.6 - 588.7; 745.7) | 0.12 | ||
| 12-week follow-up | Pb | Pb | Pb | |||
| hsCRP | 0.91 (0.01 - 8.24; 2.54) | 0.72 | 1.01 (0.01 - 4.03; 4.79) | 0.91 | 3.41 (1.03 - 8.68; 3.45) | 0.32 |
| sICAM-1 | 189.2 (3.2 - 531.5; 265.6) | 0.01 | 396.5 (59.7 - 935.6; 363.1) | 0.23 | 249.5 (2.5 - 789.9; 339.7) | 0.004 |
| sVCAM-1 | 188.9 (0.1 - 2,989.5; 1,209.5) | 0.84 | 576.6 (0.1 - 1,294.4; 984.8) | 0.35 | 439.5 (0.1 - 2,632.0; 1,790.3) | 0.44 |
| Variable | Group 1 | Group 2 | Group 3 | ||||||
|---|---|---|---|---|---|---|---|---|---|
| Baseline | 3 months | SS | Baseline | 3 months | SS | Baseline | 3 months | SS | |
| SS: statistical significance; NS: not significant (P > 0.05). Values are expresses as mean ± SD. | |||||||||
| Serum AST (IU/L) | 36.2 ± 4.6 | 36.7 ± 4.9 | NS | 35.9 ± 4.2 | 36.0 ± 4.4 | NS | 36.71 ± 4.8 | 37.0 ± 4.9 | NS |
| Serum ALT (IU/L) | 35.7 ± 4.8 | 36.0 ± 4.6 | NS | 34.8 ± 3.7 | 35.1 ± 4.2 | NS | 35.2 ± 4.3 | 36.0 ± 4.2 | NS |
| Blood urea (mg/dL) | 29.7 ± 6.5 | 29.9 ± 6.8 | NS | 29.0 ± 6.4 | 29.3 ± 6.9 | NS | 29.1 ± 6.3 | 29.5 ± 6.6 | NS |
| Serum creatinine (mg/dL) | 1.0 ± 0.2 | 1.1 ± 0.3 | NS | 1.1 ± 0.2 | 1.1 ± 0.2 | NS | 1.0 ± 0.2 | 1.1 ± 0.2 | NS |