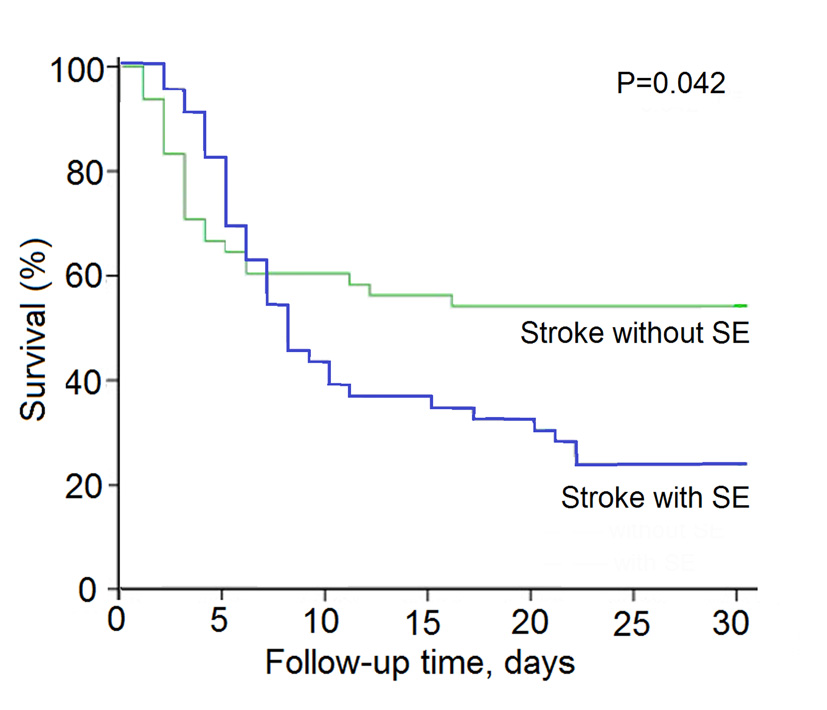
Figure 1. Kaplan-Meier survival curves for acute stroke patients with nosocomal coma with or without SE.
| Journal of Clinical Medicine Research, ISSN 1918-3003 print, 1918-3011 online, Open Access |
| Article copyright, the authors; Journal compilation copyright, J Clin Med Res and Elmer Press Inc |
| Journal website http://www.jocmr.org |
Original Article
Volume 7, Number 7, July 2015, pages 534-539
Early Prediction and Outcome of Septic Encephalopathy in Acute Stroke Patients With Nosocomial Coma
Figure
Tables
| Episodes | NC with SE (N = 46) | NC without SE (N = 48) | P |
|---|---|---|---|
| NC: nosocomial coma; SE: septic encephalopathy; ONCT: onset-to-NC time; mRS: Rankin scale. | |||
| Female gender (%) | 31/15 | 30/18 | 0.619 |
| Age (years, mean ± SD) | 61.5 ± 11.2 | 59.6 ± 12.5 | 0.431 |
| Primary intracerebral hemorrhage (%) | 24 (52.2) | 27 (56.3) | 0.692 |
| Striato-capsula (%) | 12 (50.0) | 16 (59.3) | 0.443 |
| Lobar (%) | 7 (29.2) | 8 (29.6) | 0.848 |
| Thalamus (%) | 2 (8.3) | 2 (7.4) | 0.088 |
| Brain stem (%) | 3 (12.5) | 1 (3.7) | 0.287 |
| Intraventricular extension (%) | 8 (33.3) | 10 (37.0) | 0.672 |
| Hematoma volume (mL) | 17.6 ± 12.9 | 31.6 ± 20.7 | 0.007 |
| Infarction (%) | 19 (41.3) | 13 (27.1) | 0.146 |
| Cardioembolic stroke (%) | 1 (5.3) | 1 (7.7) | 0.780 |
| Atherothrombotic (%) | 10 (52.6) | 9 (69.2) | 0.348 |
| Lacunar stroke (%) | 7 (36.8) | 3 (23.1) | 0.409 |
| Other (%) | 1 (5.3) | 0 (0.0) | 0.401 |
| Cerebral infarcts volume (mL) | 18.4 ± 63.5 | 78.9 ± 98.0 | 0.042 |
| Subarachnoid hemorrhage (%) | 3 (6.5) | 8 (16.7) | 0.126 |
| Underlying diseases | |||
| Hypertension (%) | 23 (50.0) | 31 (64.6) | 0.153 |
| Atrial fibrillation (%) | 3 (6.5) | 2 (4.2) | 0.611 |
| Diabetes (%) | 2 (4.3) | 5 (10.4) | 0.263 |
| Conditions of NNC | |||
| Median ONCT (days, range) | 3.7 (19.0) | 1.5 (41.0) | 0.002 |
| Central brain herniation (%) | 27 (58.7) | 28 (58.3) | 0.972 |
| Uncal herniation (%) | 5 (10.9) | 9 (18.8) | 0.283 |
| Mechanical ventilation (%) | 29 (63.0) | 25 (52.1) | 0.304 |
| Length of ICU and hospital stay (days) | 11.4 ± 12.7 | 11.9 ± 11.8 | 0.850 |
| mRS score, mean ± SD | 5.1 ± 1.6 | 4.9 ± 1.6 | 0.650 |
| Mortality in 30 days (%) | 35 (76.1) | 22 (45.8) | 0.003 |
| Episodes | NC with SE (N = 46) | NC without SE (N = 48) | P |
|---|---|---|---|
| NC: nosocomial coma; SE: septic encephalopathy; SBP: systolic blood pressure; DBP: diastolic blood pressure; GCS: Glasgow coma scale; SOFA: sequential organ failure assessment. *The patients with SIRS without infection. | |||
| Body temperature ≥ 39 °C (%) | 34 (73.9) | 3 (6.3) | 0.000 |
| Heart rate (beats/min) | 109.5 ± 16.7 | 88.5 ± 19.9 | 0.000 |
| Respiratory rate (breaths/min) | 27.9 ± 6.4 | 22.5 ± 5.1 | 0.000 |
| leukocyte count (× 109/L) | 14.9 ± 4.6 | 11.2 ± 6.0 | 0.000 |
| Platelet count (× 109/L) | 220.3 ± 40.3 | 219.9 ± 30.6 | 0.966 |
| SBP, mm Hg, mean ± SD | 148.3 ± 47.3 | 168.6 ± 46.9 | 0.039 |
| DBP, mm Hg, mean ± SD | 81.6 ± 25.8 | 99.8 ± 30.9 | 0.023 |
| Initial GCS, mean ± SD | 10.2 ± 1.4 | 10.1 ± 1.4 | 0.894 |
| Severe SIRS (%) | 46 (100.0) | 3 (6.3)* | 0.000 |
| Acute respiratory failure (%) | 18 (39.1) | 6 (12.5) | 0.003 |
| Septic shock (%) | 8 (17.4) | 0 (0.0) | 0.003 |
| Acute renal failure (%) | 12 (26.1) | 8 (16.7) | 0.265 |
| Acute hepatic failure (%) | 2 (4.3) | 1 (2.0) | 0.532 |
| Hyperglycemia, mean ± SD | 6.55 ± 2.34 | 6.81 ± 2.91 | 0.685 |
| Hypernatremia (> 150 mmo1/L) | 7 (15.2) | 1 (2.0) | 0.016 |
| Hyponatremia (< 110 mmol/L) | 0 (0.0) | 1 (2.0) | 0.325 |
| Acute seizures (%) | 3 (6.5) | 4 (8.3) | 0.738 |
| SOFA, mean ± SD | 4.8 ± 2.7 | 2.5 ± 1.9 | 0.000 |
| Repeat CT scan or MRI | |||
| Vasogenic brain edema (%) | 24 (52.2) | 6 (12.5) | 0.000 |
| Subcortical whiter matter lesion (%) | 10 (21.7) | 2 (4.2) | 0.011 |
| Diffuse cerebral swelling (%) | 32 (69.6) | 40 (83.3) | 0.115 |
| Thalamus compression/central herniation (%) | 33 (71.7) | 32 (66.7) | 0.595 |
| Midbrain compression/uncal herniation (%) | 5 (10.9) | 9 (18.8) | 0.238 |
| Hematoma growth (%) | 1 (2.2) | 23 (47.9) | 0.000 |
| Infarction progress (%) | 2 (4.3) | 11 (22.9) | 0.009 |
| Recurrent SAH (%) | 0 (0.0) | 6 (12.5) | 0.011 |
| Hemorrhagic transformation (%) | 0 (0.0) | 2 (4.2) | 0.162 |
| Episodes | OR | 95% CI | P |
|---|---|---|---|
| SE: septic encephalopathy; SIRS: systemic inflammatory response syndrome; OR: odds ratio; CI: confidence intervals. | |||
| Fever (≥ 39 °C) | 2.753 | 1.116 - 6.794 | 0.028 |
| SIRS (≥ 3 items) | 6.459 | 2.050 - 20.351 | 0.001 |