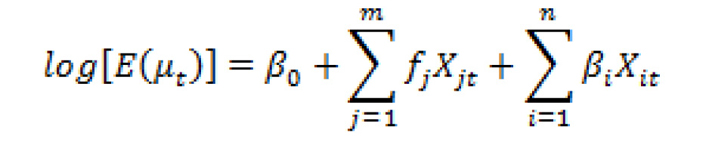
Figure 1. The generalized additive models formula.
| Journal of Clinical Medicine Research, ISSN 1918-3003 print, 1918-3011 online, Open Access |
| Article copyright, the authors; Journal compilation copyright, J Clin Med Res and Elmer Press Inc |
| Journal website http://www.jocmr.org |
Original Article
Volume 7, Number 7, July 2015, pages 551-555
The Association of Air Pollution With the Patients’ Visits to the Department of Respiratory Diseases
Figures
Tables
| Min | Max | Median | Four quartile range | |
|---|---|---|---|---|
| Tmin (°C) | -10.00 | 29.00 | 14.00 | 18.00 |
| PM2.5 (μg/m3) | 21.00 | 444.00 | 81.00 | 52.75 |
| PM2.5td (μg/m3) | 60.00 | 773.00 | 163.00 | 101.50 |
| CO (mg/m3) | 0.38 | 4.19 | 1.12 | 0.69 |
| NO2 (μg/m3) | 13.00 | 134.00 | 52.50 | 28.00 |
| SO2 (μg/m3) | 17.00 | 228.00 | 58.50 | 63.75 |
| Variables | Estimated values | SEM | t value | P value |
|---|---|---|---|---|
| Intercept | 3.5811 | 0.0484 | 73.96 | < 0.0001 |
| Factor 1 | 0.0265 | 0.0084 | 3.16 | 0.0017 |
| Week | 0.0030 | 0.0002 | 17.32 | < 0.0001 |
| Linear (Tmin) | -0.0109 | 0.0007 | -15.38 | < 0.0001 |
| Linear (PMtd) | 0.0011 | 0.0001 | 14.49 | < 0.0001 |
| Smooth components | Smooth parameter | Degree of freedom | Generalized cross-validation (GCV) | No. of variables at different values |
|---|---|---|---|---|
| Spline (Tmin) | 0.9982 | 4.2724 | 0.0497 | 40 |
| Spline (PMtd) | 0.9999 | 4.2320 | 0.0551 | 193 |
| Smooth components | Degree of freedom | Sum of square | χ2 value | P value |
|---|---|---|---|---|
| Spline (Tmin) | 4.2724 | 312.93 | 48.57 | < 0.0001 |
| Spline (PMtd) | 4.2320 | 99.69 | 15.47 | 0.0047 |