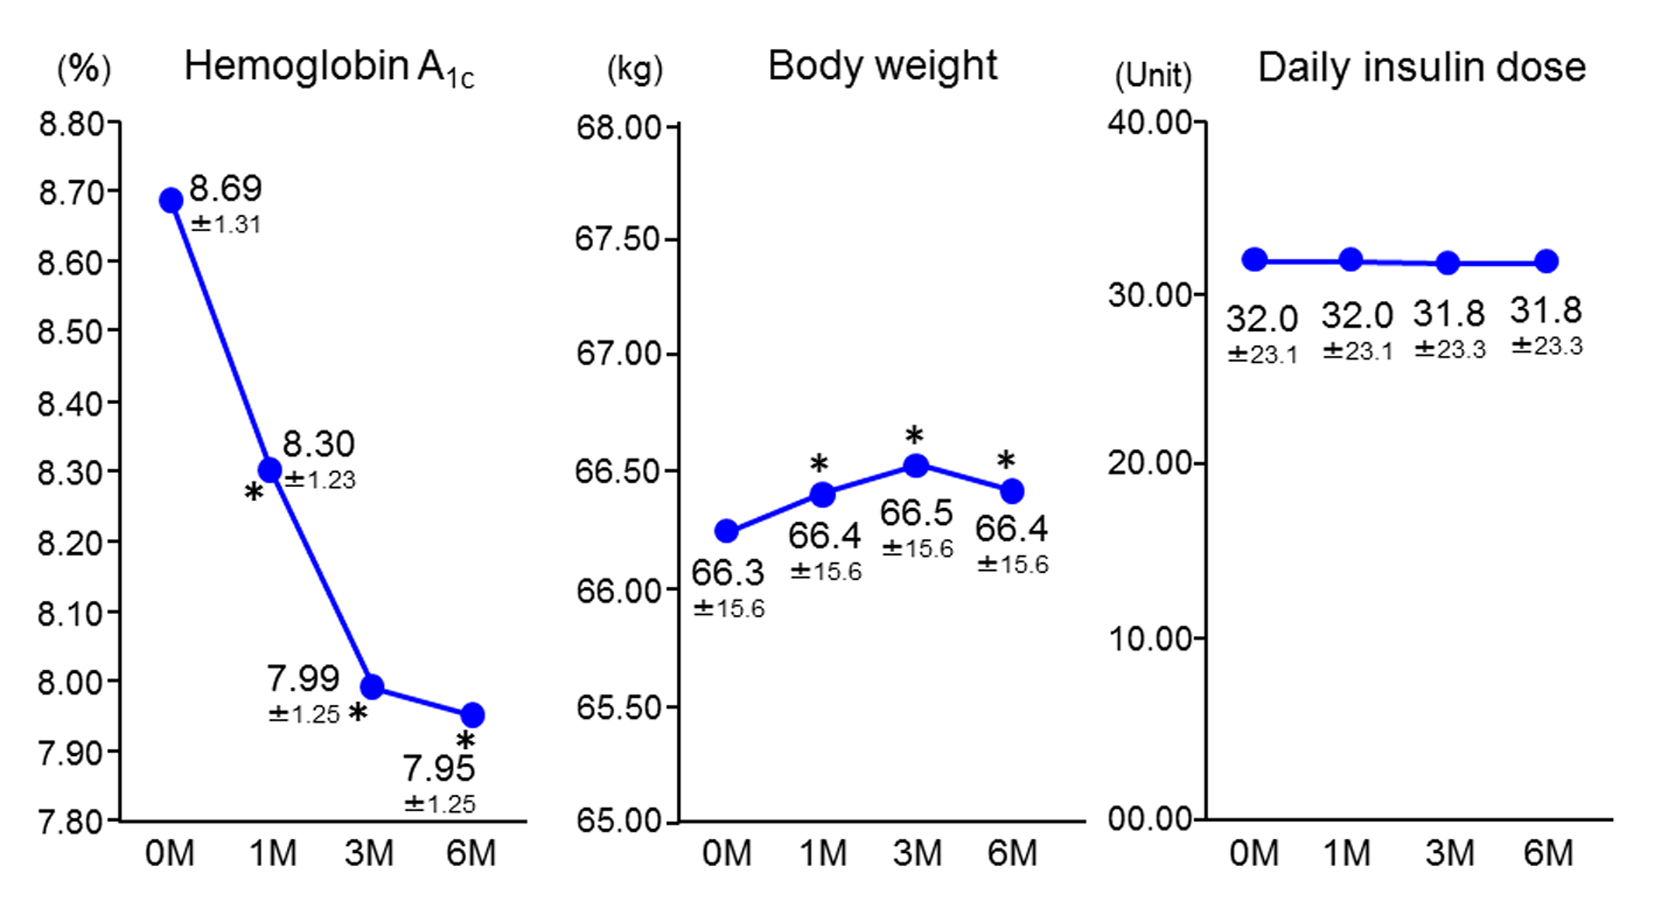
Figure 1. Changes in hemoglobin A1c, body weight, and insulin dose (n = 1,004). Data are the mean ± standard deviation. Analysis of variance vs. baseline. *P < 0.05. M: months.
| Journal of Clinical Medicine Research, ISSN 1918-3003 print, 1918-3011 online, Open Access |
| Article copyright, the authors; Journal compilation copyright, J Clin Med Res and Elmer Press Inc |
| Journal website http://www.jocmr.org |
Original Article
Volume 7, Number 8, August 2015, pages 607-612
Factors Predicting Therapeutic Efficacy of Combination Treatment With Sitagliptin and Insulin in Type 2 Diabetic Patients: The ASSIST-K Study
Figure
Tables
| Data are mean ± standard deviation unless otherwise indicated. | |
| Age, years | 63.9 ± 12.1 |
| Sex, male/female | 521/483 |
| Body mass index | 25.5 ± 4.6 |
| Hemoglobin A1c, % (mmol/mol) | 8.69 ± 1.31 (72 ± 12) |
| Fasting blood glucose, mg/dL (mmol/L) | 184.3 ± 70.5 (10.23 ± 3.91) |
| Serum C-peptide, ng/mL (nmol/L) | 1.47 ± 1.03 (0.49 ± 0.34) |
| Duration of diabetes, years | 17.1 ± 9.0 |
| Duration of insulin treatment, years | 6.3 ± 5.6 |
| Smoking, % | 23.1 |
| Alcohol consumption, % | 22.7 |
| Complications, % | |
| Diabetic neuropathy | 33.6 |
| Diabetic retinopathy | 33.4 |
| Diabetic nephropathy | 38.5 |
| Cerebrovascular disease | 7.6 |
| Myocardial infarction/angina pectoris | 17.3 |
| Arteriosclerosis obliterans | 8.8 |
| Hypertension | 57.7 |
| Dyslipidemia | 61.4 |
| Hepatic steatosis | 30.0 |
| Insulin regimen, n | |
| Long-acting insulin, once daily | 215 |
| Mixed insulin, twice daily | 162 |
| Three times daily, no long-acting insulin | 209 |
| Basal-bolus insulin | 334 |
| Concomitant oral medications, n | |
| Sulfonylureas | 222 |
| Biguanides | 397 |
| Thiazolidinediones | 64 |
| Alpha-glucosidase inhibitors | 184 |
| None | 418 |
| Dose of sitagliptin, n | |
| 25 mg throughout | 65 |
| Up-titration from 25 mg to 50 mg | 83 |
| 50 mg throughout | 809 |
| Up-titration from 50 mg to 100 mg | 47 |
| Clinical parameter | n | Baseline | 1 month | 3 months | 6 months | Difference between baseline and 6 months |
|---|---|---|---|---|---|---|
| aP < 0.05 (analysis of variance vs. baseline). BP: blood pressure; HDL: high-density lipoprotein; LDL: low-density lipoprotein. | ||||||
| Systolic BP, mm Hg | 923 | 130.82 | 130.85 | 130.38 | 130.28 | |
| Diastolic BP, mm Hg | 923 | 74.97 | 74.66a | 74.03a | 74.22a | -0.75 |
| Fasting blood glucose, mg/dL (mmol/L) | 199 | 181.35 (10.06) | 160.62 (8.91)a | 164.81 (9.15)a | 160.9 (8.93)a | -20.45 (-1.13) |
| Serum C-peptide, ng/dL (nmol/L) | 53 | 0.91 (0.30) | 0.98 (0.32) | 1 (0.33) | 0.96 (0.32) | |
| Glycated albumin, % | 53 | 23.2 | 21.61a | 21.05a | 21.03a | -2.17 |
| Aspartate aminotransferase, IU/L (µkat/L) | 773 | 27.62 (0.46) | 26.41 (0.44) | 27.02 (0.45) | 27.56 (0.46) | |
| Alanine aminotransferase, IU/L (µkat/L) | 770 | 24.66 (0.41) | 24.11 (0.40) | 24.79 (0.41) | 24.22 (0.40) | |
| Gamma-glutamyl transpeptidase, IU/L | 703 | 44.12 | 42.22 | 42.12 | 43.47 | |
| Alkaline phosphatase, mg/dL | 175 | 260.05 | 254.16a | 241.82a | 241.83a | -18.22 |
| Total cholesterol, mg/dL (mmol/L) | 453 | 194.72 (5.04) | 191.56 (4.96)a | 190.26 (4.93)a | 191.39 (4.96)a | -3.33 (-0.08) |
| LDL cholesterol, mg/dL (mmol/L) | 733 | 109.66 (2.84) | 109.02 (2.82) | 108.67 (2.81) | 109.08 (2.83) | |
| HDL cholesterol, mg/dL (mmol/L) | 794 | 55.62 (1.44) | 55.05 (1.43)a | 54.8 (1.42)a | 54.72 (1.42)a | -0.90 (-0.02) |
| Triglycerides, mg/dL (mmol/L) | 805 | 164.12 (1.85) | 153.61 (1.74)a | 153.3 (1.73)a | 155.33 (1.76)a | -8.79 (-0.09) |
| Uric acid, mg/dL (µmol/L) | 331 | 5.05 (300.40) | 5.18 (308.13)a | 5.32 (316.46)a | 5.27 (313.49)a | +0.25 (+13.09) |
| Creatinine, mg/dL (µmol/L) | 674 | 0.76 (67.18) | 0.77 (68.07)a | 0.78 (68.95)a | 0.79 (69.84)a | +0.03 (+2.66) |
| Factor | Beta value | P value | Standardized beta value |
|---|---|---|---|
| Age | -0.010 | 0.0088 | -0.124 |
| Female sex | 0.164 | 0.0802 | 0.080 |
| Baseline body mass index | 0.030 | 0.0048 | 0.136 |
| Duration of insulin treatment, years | 0.013 | 0.1383 | 0.065 |
| Baseline hemoglobin A1c | -0.400 | < 0.0001 | -0.502 |
| Baseline daily insulin dose | 0.002 | 0.2401 | 0.057 |
| Presence of diabetic neuropathy | 0.051 | 0.5512 | 0.025 |
| Smoking, yes | 0.004 | 0.9694 | 0.002 |
| Alcohol consumption, yes | -0.004 | 0.9683 | -0.002 |
| Sulfonylureas | 0.191 | 0.0939 | 0.074 |
| Biguanides | -0.162 | 0.0720 | -0.078 |
| Thiazolidinediones | -0.300 | 0.0800 | -0.072 |
| Alpha-glucosidase inhibitors | -0.096 | 0.3606 | -0.037 |