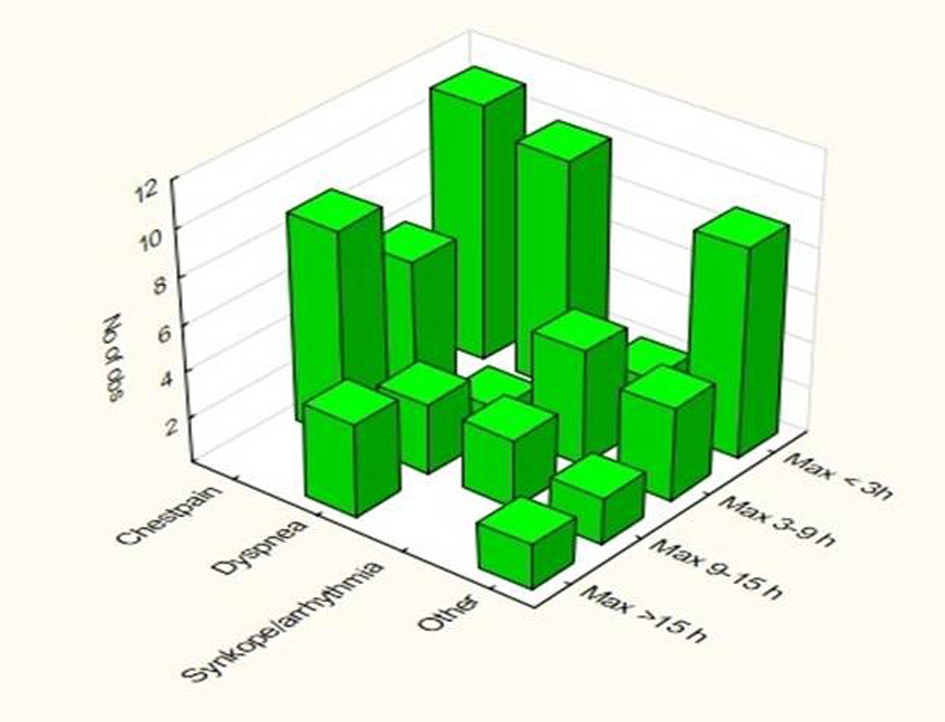
Figure 1. Distribution of the peak TnT level among four time categories after admission in relation to the different chief complaints.
| Journal of Clinical Medicine Research, ISSN 1918-3003 print, 1918-3011 online, Open Access |
| Article copyright, the authors; Journal compilation copyright, J Clin Med Res and Elmer Press Inc |
| Journal website http://www.jocmr.org |
Original Article
Volume 7, Number 6, June 2015, pages 464-471
Chief Complaint at Admission Relates to Troponin Level and Mortality in Patients With Non-ACS Troponin Elevation
Figures
Tables
| ACS (n = 50) | Non-ACS TnT-el (n = 71) | Non-sign TnT-el (n = 33) | TnT-el of indet orig (n = 8) | No TnT-el (n = 325) | |
|---|---|---|---|---|---|
| Values are mean ± SD, median (IQR) or number (%). El: elevation; sign: significant; indet: indeterminate; orig: origin; CHF: congestive heart failure; CAD: former percutaneous coronary intervention and/or coronary artery bypass grafting and/or acute myocardial infarction; BMI: body mass index; AF: atrial fibrillation/flutter; PM: pacemaker; HF: heart frequency; SBP: systolic blood pressure; DBT: diastolic blood pressure; eGFR: estimated glomerular filtration rate according to MDRD; Hb: hemoglobin; CRP: C-reactive protein; CCU: coronary care unit. *P < 0.05 vs. non-ACS TnT-el. **P < 0.001 vs. non-ACS TnT-el. | |||||
| Age (years) | 74 ± 14 | 77 ± 12 | 70 ± 15 | 76 ± 13 | 64 ± 14 |
| Female | 21 (42) | 28 (39) | 12 (36) | 6 (75) | 165 (51) |
| Current smoker | 8 (16) | 10 (14) | 4 (12) | 1 (13) | 58 (18) |
| Previous | 13 (26) | 25 (35) | 17 (52) | 3 (38) | 94 (29) |
| CHF | 14 (28)* | 36 (51) | 8 (24) | 0 | 25 (8) |
| CAD | 25 (50) | 35 (49) | 15 (45) | 2 (25) | 90 (28) |
| Hypertension | 24 (48) | 44 (62) | 21 (64) | 4 (50) | 157 (48) |
| Diabetes | 13 (26) | 25 (35) | 7 (21) | 3 (38) | 39 (12) |
| BMI (kg/m2) | 26.3 ± 5.6 | 24.9 ± 4.7 | 25.8 ± 4.9 | 25 ± 2.9 | 27.1 ± 5.0 |
| AF on arrival | 6 (12)* | 23 (32) | 10 (30) | 1 (13) | 34 (10) |
| HF (beats/min) | 91 ± 26 | 96 ± 30 | 82 ± 30 | 88 ± 28 | 78 ± 19 |
| SBP (mm Hg) | 152 ± 30 | 141 ± 33 | 148 ± 33 | 155 ± 18 | 154 ± 29 |
| DBP (mm Hg) | 86 ± 19* | 77 ±18 | 80 ± 16 | 86 ± 13 | 83 ± 15 |
| eGFR (mL/min/1.732) | 61 ± 30* | 49 ± 26 | 56 ± 24 | 57 ± 24 | 77 ± 20 |
| Hb (g/L) | 131±29 | 126 ± 21 | 132 ± 16 | 136 ± 20 | 139 ± 15 |
| CRP (mg/L) | 6 (2 - 36) | 14 (4 - 42) | 7 (3 - 19) | 6 (2 - 8) | 2 (0 - 4) |
| Glucose (mmol/L) | 7.5 (6.1 - 11.2) | 7 (5.7 - 9.2) | 6.9 (6.1 - 8.1) | 9.4 (6.9 - 15.1) | 6.1 (5.4 - 7.1) |
| Transferral CCU | 29 (58)** | 16 (23) | 5 (15) | 5 (63) | 27 (8) |
| Hospitalization (days) | 4 (3 - 7)** | 2.5 (1 - 4.5) | 2 (1 - 4) | 4 (2 - 10) | 1 (0.5 - 1) |
| Chief complaints | ACS (n = 50) | Non-ACS TnT-el (n = 71) | Non-sign TnT-el (n = 33) | TnT-el of indet orig (n = 8) | No TnT-el (n = 325) |
|---|---|---|---|---|---|
| Values are number (%). One patient with a procedure related acute myocardial infarction is not presented in the table. El: elevation; sign: significant; indet: indeterminate; orig: origin. *P < 0.001 vs. non-ACS TnT-el. | |||||
| Chest pain | 37 (74)* | 26 (37) | 24 (73) | 6 (75) | 268 (82) |
| Dyspnoea | 8 (16)* | 18 (25) | 4 (12) | 1 (13) | 9 (3) |
| Syncope/arrhythmia | 3 (6)* | 10 (14) | 4 (12) | 0 | 42 (13) |
| Others | 2 (4)* | 17 (24) | 1 (3) | 1 (13) | 6 (2) |
| Troponin categories | ACS (n = 50) | Non-ACS TnT-el (n = 71) | P-value | Non-ACS TnT-el (n = 71) | ||||
|---|---|---|---|---|---|---|---|---|
| Chest pain (n = 26) | Dyspnea (n = 18) | Syncope/arrhythmia (n = 10) | Others (n = 17) | P-value | ||||
| Values are median (IQR) (number of measurements) or number (%). P-value denotes comparison between ACS and non-ACS TnT-el with Mann-Whitney U-test or between all groups with Kruskall-Wallis ANOVA or maximum likelihood Chi-square. | ||||||||
| TnT < 3 h (μg/L) | 0.05 (0.01 - 0.14) (44) | 0.05 (0.03 - 0.08) (66) | 0.04 (0.03 - 0.06) (25) | 0.06 (0.04 - 0.08) (17) | 0.04 (0.02 - 0.05) (9) | 0.06 (0.03 - 0.15) (15) | 0.18 | |
| TnT 3 - 9 h (μg/L) | 0.23 (0.10 - 0.51) (37) | 0.05 (0.04 - 0.11) (60) | 0.04 (0.02 - 0.08) (23) | 0.07 (0.05 - 0.1) (13) | 0.05 (0.04 - 0.14) (10) | 0.07 (0.04 - 0.14) (14) | 0.19 | |
| TnT 9 - 15 h (μg/L) | 0.26 (0.1 - 0.97) (22) | 0.06 (0.04 - 0.13) (50) | 0.04 (0.03 - 0.1) (21) | 0.08 (0.06 - 0.13) (15) | 0.06 (0.04 - 0.13) (9) | 0.07 (0.06 - 0.15) (5) | 0.16 | |
| TnT > 15 h (μg/L) | 0.55 (0.20 - 1.32) (24) | 0.10 (0.04 - 0.3) (15) | 0.03 (0.03 - 0.03) (2) | 0.10 (0.05 - 0.37) (7) | 0.03 (0.03 - 0.03) (1) | 0.23 (0.10 - 0.3) (5) | 0.07 | |
| Max TnT (μg/L) | 0.31 (0.12 - 0.83) (50) | 0.06 (0.04 - 0.12) (71) | < 0.001 | 0.04 (0.03 - 0.07) (26) | 0.08 (0.06 - 0.12) (18) | 0.06 (0.04 - 0.14) (10) | 0.08 (0.04 - 0.16) (17) | 0.04 |
| Time to max TnT (h:min) | 8:19 (3:01 - 18:21) | 6:02 (0:31 - 11:02) | < 0.001 | 6:10 (0:55 - 10:17) | 2:29 (0:24 - 13:14) | 6:57 (3:56 - 11:02) | 0:57 (0:19 - 8:59) | 0.72 |
| No. of max < 3 h | 12 (24) | 32 (45) | 11 (42) | 10 (56) | 2 (20) | 9 (53) | ||
| No. of max 3 - 9 h | 13 (26) | 16 (23) | 6 (23) | 1 (6) | 5 (50) | 4 (24) | ||
| No. of max 9 - 15 h | 7 (14) | 17 (24) | 9 (34) | 3 (17) | 3 (30) | 2 (12) | ||
| No. of max > 15 h | 18 (36) | 6 (9) | < 0.001 | 0 | 4 (22) | 0 | 2 (12) | 0.02 |
| ACS (n = 50) | Non-ACS-TnT elevation (n = 71) | |||
|---|---|---|---|---|
| Hazard ratio (95% CI) | P-value | Hazard ratio (95% CI) | P-value | |
| Hazard ratios (HR) apply for an SD increase in continuous variables and for yes compared to no for all categorical variables. *Non-significant, HR and CI. | ||||
| Age (years) | 2.68 (1.34 - 5.36) | 0.005 | 1.66 (0.86 - 3.22) | 0.13 |
| Male gender | 0.19 (0.04 - 0.90) | 0.03 | 3.5 (0.77 - 16.0) | 0.10 |
| Diabetes | 1.00(0.21 - 4.82) | 0.99 | 0.67 (0.18 - 2.50) | 0.56 |
| Hypertension | 0.36 (0.09 - 1.43) | 0.15 | 0.32 (0.10 - 1.07) | 0.06 |
| Previous AMI | 11.1 (1.4 - 89.3) | 0.02 | 1.03 (0.33 - 3.21) | 0.95 |
| CHF | 8.4 (2.08 - 34.2) | 0.003 | 2.12 (0.64 - 7.05) | 0.22 |
| Current smoking | * | 0.99 | 1.94 (0.53 - 7.19) | 0.32 |
| Ever smoking | 0.25 (0.05 - 1.19) | 0.08 | 0.66 (0.21 - 2.05) | 0.47 |
| eGFR | 0.49 (0.29 - 0.82) | 0.007 | 0.55 (0.31 - 0.96) | 0.03 |
| logCRP | 2.5 (1.6 - 4.0) | < 0.001 | 2.2 (1.3 - 3.8) | 0.004 |
| Max TnT | 1.29 (1.08 - 1.54) | 0.005 | 0.51 (0.03 - 9.5) | 0.66 |
| Abs increase | 1.24 (0.92 - 1.67) | 0.15 | 0.08 (0.00 - 87) | 0.49 |
| Abs decrease | 0.81 (0.64 - 1.04) | 0.09 | 0.60 (0.08 - 4.6) | 0.62 |
| Chief complaint | ||||
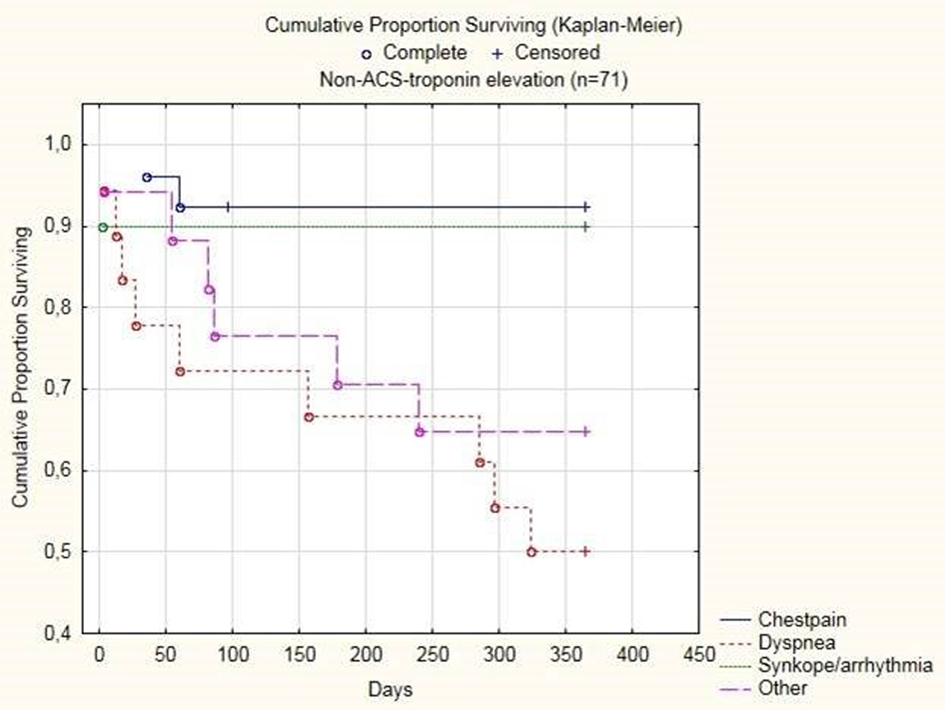
| Chest pain | 2.7 (0.61 - 12.0) | 0.18 | 0.19 (0.04 - 0.82) | 0.03 |
| Dyspnea | * | 0.99 | 3.5 (1.4 - 8.7) | 0.01 |
| Arrhythmia | 0.97(0.13 - 7.3) | 0.97 | 0.3 (0.05 - 2.6) | 0.29 |
| Other | 2.6 (0.3 - 19.7) | 0.36 | 1.6 (0.6 - 4.4) | 0.31 |
| Cause | ||||
| Renal failure | 3.8 (1.1 - 13.0) | 0.04 | ||
| Structural heart disease | 1.4 (0.6 - 3.6) | 0.44 | ||
| Arrhythmia | 0.7 (0.2 - 2.5) | 0.60 | ||
| Respiratory disease | 1.2 (0.4 - 3.6) | 0.75 | ||
| Infection | 2.1 (0.8 - 6.0) | 0.15 | ||