Journal of Clinical Medicine Research, ISSN 1918-3003 print, 1918-3011 online, Open Access
Article copyright, the authors; Journal compilation copyright, J Clin Med Res and Elmer Press Inc
Journal website http://www.jocmr.org

Original Article

Volume 7, Number 6, June 2015, pages 446-452


Efficacy of Statin Monotherapy or in Combination With Coenzyme A Capsule in Patients With Metabolic Syndrome and Mixed Dyslipidemia

Figures

Figure 1.
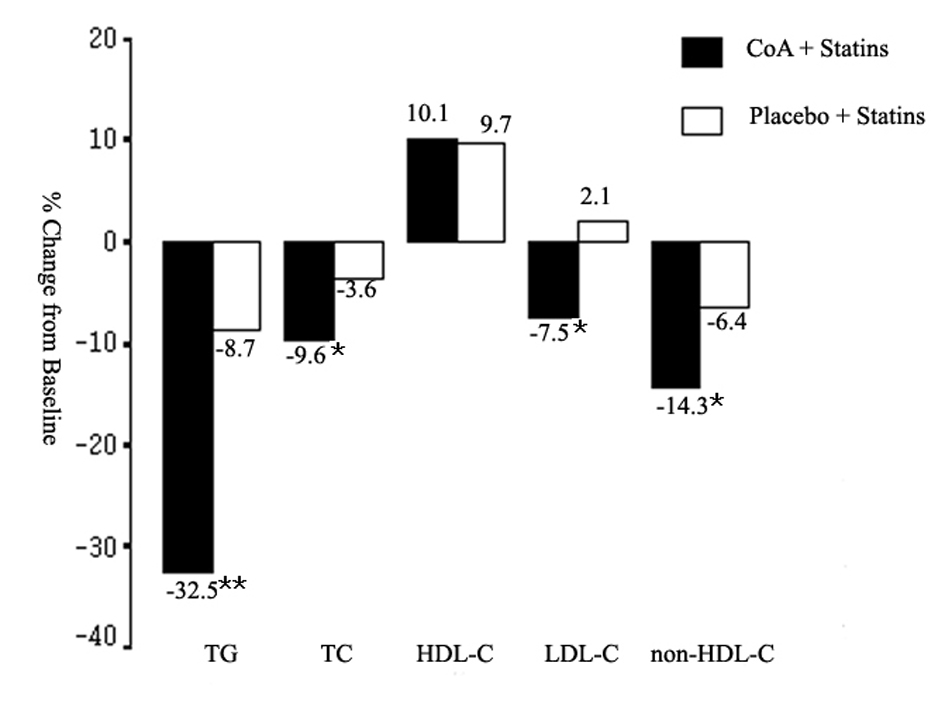
Figure 1. Mean percent change in triglyceride (TG), total cholesterol (TC), high-density lipoprotein cholesterol (HDL-C), low-density lipoprotein cholesterol (LDL-C), and non-HDL-C from baseline to the end of study. CoA: coenzyme A. *P < 0.05; **P < 0.01.
Figure 2.
Figure 2. Rates of achievement of the NCEP ATPIII therapeutic goals at the end of treatment. *P < 0.05.

Tables

Table 1. Demographics and Baseline Characteristics
 
CharacteristicStatin + CoA (n = 118)Statin + placebo (n = 94)P value
CoA: coenzyme A; BMI: body mass index; SBP: systolic blood pressure; DBP: diastolic blood pressure; ACEI: angiotensin-converting enzyme inhibitor; ARB: angiotensin receptor blocker; MetS: metabolic syndrome; FPG: fasting plasma glucose; BP: blood pressure.
Age (years)55.6 ± 11.653.6 ± 13.10.25
Male gender (n, %)65 (55.1)59 (62.8)0.27
Current smokers (n, %)38 (32.2)36 (38.3)0.39
BMI (kg/m2)26.0 ± 2.725.8 ± 2.70.52
Waist circumference (cm)91.4 ± 10.690.9 ± 10.10.72
SBP (mm Hg)134.8 ± 12.5131.4 ± 14.50.07
DBP (mm Hg)81.6 ± 9.781.6 ± 8.70.96
Hypertension (n, %)56 (47.5)40 (42.6)0.49
Diabetes mellitus (n, %)21 (17.8)23 (24.5)0.24
ACEIs/ARBs (n, %)35 (29.7)24 (25.5)0.54
β-blockers (n, %)25 (21.2)17 (18.1)0.61
Calcium channel blockers (n, %)34 (28.8)18 (19.1)0.11
Diuretics (%, n)7 (5.9)1 (1.1)0.079
Platelet aggregation inhibitors (n, %)18 (15.3)14 (14.9)1.00
Statins0.70
  Atorvastatin (n, %)74 (62.7)63 (67.0)
  Rosuvastatin (n, %)12 (10.2)5 (5.3)
  Simvastatin (n, %)22 (18.6)17 (18.1)
  Fluvastatin (n, %)9 (7.6)7 (7.4)
  Lovastatin (n, %)1 (0.8)0 (0.0)
MetS components (n)3 (3 - 5)3 (3 - 5)0.37
Waist criterion (n, %)79 (66.9)63 (67.0)1.00
FPG criterion (n, %)82 (69.5)68 (72.3)0.76
TG criterion (n, %)118 (100.0)94 (100.0)1.00
HDL-C criterion (n, %)41 (34.7)43 (45.7)0.12
BP criterion (n, %)93 (78.8)69 (73.4)0.42


Table 2. Percentage Change From Baseline to Follow-Up in Levels of Serum Lipoproteins
 
VariableStatin + CoA (n = 118)Statin + placebo (n = 94)P value
CoA: coenzyme A; TG: triglyceride; TC: total cholesterol; HDL-C: high-density lipoprotein cholesterol; LDL-C: low-density lipoprotein cholesterol.
TG
  Baseline mean (mg/dL)318.8 ± 114.2305.5 ± 99.2
  Final mean (mg/dL)215.2 ± 126.6275.4 ± 172.7
  Mean change, % ± SE (median)-32.47 ± 28.30 (-36.81)-8.69 ± 49.12 (-19.66)0.0002
TC
  Baseline mean (mg/dL)204.2 ± 42.9192.2 ± 42.5
  Final mean (mg/dL)181.7 ± 38.3183.3 ± 44.9
  Mean change, % ± SE (median)-9.56 ± 17.85 (-9.86)-3.58 ± 16.47 (-4.57)0.013
HDL-C
  Baseline mean (mg/dL)45.2 ± 12.442.2 ± 11.6
  Final mean (mg/dL)48.3 ± 13.945.6 ± 14.7
  Mean change, % ± SE (median)10.07 ± 30.08 (5.93)9.73 ± 27.12 (6.49)0.93
LDL-C
  Baseline mean (mg/dL)111.0 ± 35.6103.2 ± 35.2
  Final mean (mg/dL)99.4 ± 36.3100.9 ± 35.2
  Mean change, % ± SE (median)-7.48 ± 31.40 (-11.36)2.08 ± 33.09 (-2.84)0.033
Non-HDL-C
  Baseline mean (mg/dL)159.3 ± 39.4150.0 ± 41.0
  Final mean (mg/dL)133.4 ± 37.5137.7 ± 43.3
  Mean change, % ± SE (median)-14.31 ± 22.20 (-15.84)-6.38 ± 22.40 (-7.38)0.011


Table 3. Incidence of Adverse Events
 
VariableTotal (n = 212)Statin + CoA (n = 118)Statin + placebo (n = 94)
CoA: coenzyme A; AE: adverse event.
Any AE15105
Patients who experienced any AE15105
Most common AEs
  Abdominal distention110
  Nausea110
  Elevated liver enzymes110
  Elevated creatine phosphokinase523
  Upper respiratory tract infection330