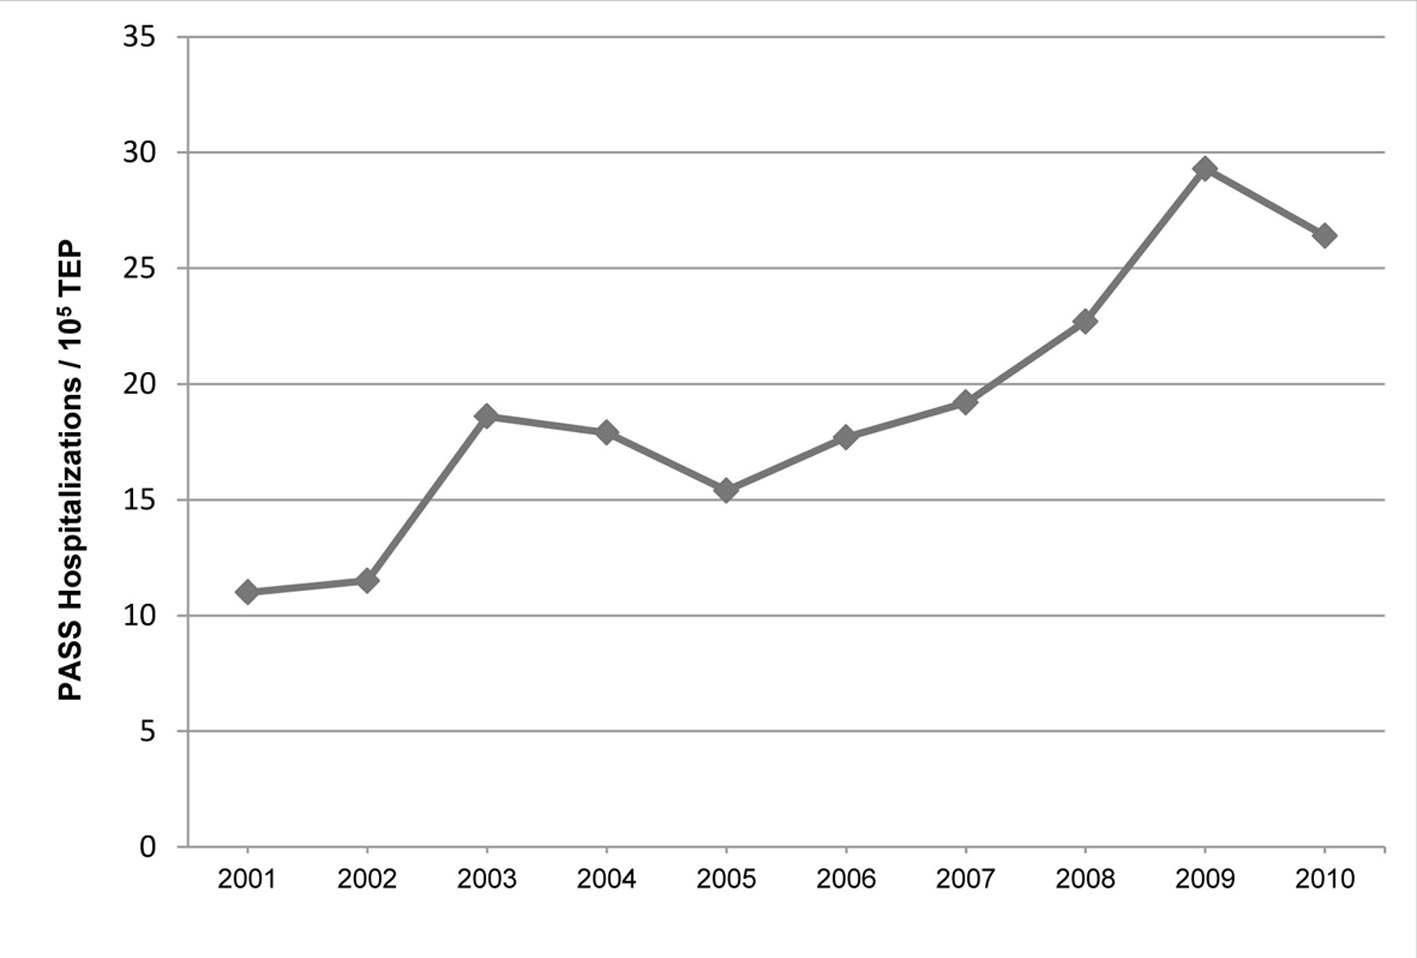
Figure 1. The age-adjusted annual incidence of PASS. PASS: pregnancy-associated severe sepsis; TEP: total estimated pregnancy.
| Journal of Clinical Medicine Research, ISSN 1918-3003 print, 1918-3011 online, Open Access |
| Article copyright, the authors; Journal compilation copyright, J Clin Med Res and Elmer Press Inc |
| Journal website http://www.jocmr.org |
Original Article
Volume 7, Number 6, June 2015, pages 400-416
Evolving Trends in the Epidemiology, Resource Utilization, and Outcomes of Pregnancy-Associated Severe Sepsis: A Population-Based Cohort Study
Figure
Tables
| Characteristic | n = 1,007 |
|---|---|
| aDerived for hospitalizations with non-masked zip code (n = 939). bBased on conditions included in the Deyo-Charlson co-morbidity index. cHuman immunodeficiency virus. dCo-morbid conditions not included in the Deyo-Charlson index. | |
| Age (years, n (%)) | |
| < 20 | 160 (15.9) |
| 20 - 34 | 689 (68.4) |
| ≥ 35 | 158 (15.7) |
| Race, n (%) | |
| Hispanic | 429 (42.6) |
| White | 308 (30.6) |
| Black | 205 (20.4) |
| Other | 63 (6.3) |
| Missing | 2 (0.2) |
| Health insurance, n (%) | |
| Private | 324 (32.2) |
| Medicaid | 537 (53.3) |
| Uninsured | 94 (9.3) |
| Other | 50 (5.0) |
| Missing | 2 (0.2) |
| Poverty level ≥ 20%, n (%)a | 241 (25.7) |
| Chronic co-morbidities, n (%)b | |
| Any | 310 (30.8) |
| Myocardial infarction | 21 (2.1) |
| Congestive heart failure | 89 (8.8) |
| Peripheral vascular disease | 9 (0.9) |
| Cerebrovascular disease | 29 (2.9) |
| Chronic pulmonary disease | 54 (5.4) |
| Connective tissue disease | 16 (1.6) |
| Peptic ulcer disease | 5 (0.5) |
| Chronic liver disease | 89 (8.8) |
| Diabetes mellitus | 39 (3.9) |
| Chronic kidney disease | 34 (3.4) |
| Malignancy | 6 (0.6) |
| HIV infectionc | 4 (0.4) |
| Deyo-Charlson score | |
| Mean (SD) | 0.51 (0.96) |
| Median (IQR) | 0 (0 - 1) |
| Other conditions, n (%)d | |
| Smoking | 30 (3.0) |
| Drug abuse | 52 (5.2) |
| Alcohol abuse | 2 (0.2) |
| Obesity | 46 (4.6) |
| Teaching hospitals | |
| Number (%) of hospitals | 35 (17.9) |
| Number (%) of hospitalizations | 310 (30.8) |
| Characteristic | n = 1,007 |
|---|---|
| aThere were 26 fetal loss/induced abortion-related hospitalizations whose only pregnancy-related diagnosis was ICD-9-CM code 639.XX, precluding assignment to either group; upper estimates of the number and percent of fetal loss and induced abortion hospitalizations were provided after the slash for each. bSelected conditions acquired or associated with pregnancy, but not included among other listed co-morbidities. cThe total reported percentage exceeds 100, as more than one infection site has been reported for some hospitalizations. | |
| Type of pregnancy-related hospitalization, n (%) | |
| Fetal lossa | 104 (10.3)/130 (12.9) |
| Abortiona | 9 (0.9)/35 (3.5) |
| Antepartum | 247 (24.5) |
| Delivery | 378 (37.5) |
| Postpartum | 243 (24.1) |
| Obstetric risk factors, n (%)b | |
| Multiple gestation | 9 (0.9) |
| Retained products of conception | 31 (3.1) |
| Prolonged rupture of membranes | 11 (1.1) |
| Preeclampsia/eclampsia | 93 (9.2) |
| Anemia | 350 (34.8) |
| Gestational diabetes | 24 (2.4) |
| Site of infection, n (%)c | |
| Respiratory | 250 (24.8) |
| Urinary | 335 (33.3) |
| Genital | 418 (41.5) |
| Abdominal | 98 (9.7) |
| Device-related | 36 (3.6) |
| Other | 50 (5.0) |
| Microbiology, n (%) | |
| Gram-positive | 118 (11.7) |
| Gram-negative | 184 (18.3) |
| Anerobes | 9 (0.9) |
| Other bacteria | 31 (3.1) |
| Fungal | 13 (1.3) |
| Not reported | 652 (64.7) |
| Variable | 2001 - 2002 (n = 113) | 2009 - 2010 (n = 300) | P value |
|---|---|---|---|
| aTEP: total estimated pregnancy. bChronic co-morbidities included in the Deyo-Charlson index. cAdjusted for inflation (2,010 dollars). dInpatient rehabilitation, hospice, leaving against medical advice. | |||
| Age-adjusted incidence (per 105 TEPa) | |||
| All | 11 | 27 | < 0.0001 |
| Hispanic | 10 | 27 | < 0.0001 |
| White | 10 | 23 | < 0.0001 |
| Black | 17 | 37 | 0.0020 |
| Age ≥ 35 years, n (%) | 16 (14.2) | 34 (11.3) | 0.5381 |
| Chronic co-morbidity, n (%)b | 32 (28.3) | 100 (33.3) | 0.3920 |
| Deyo-Charlson score | |||
| Mean (SD) | 0.38 (0.81) | 0.56 (0.97) | |
| Median (IQR) | 0 (0 - 1) | 0 (0 - 1) | 0.1173 |
| Obesity, n (%) | 1 (0.9) | 22 (7.3) | 0.0211 |
| Organ failures, n (%) | |||
| Respiratory | 65 (57.7) | 193 (64.3) | 0.2459 |
| Cardiovascular | 36 (31.9) | 181 (60.3) | < 0.0001 |
| Renal | 20 (18) | 94 (31) | 0.0099 |
| Hepatic | 4 (3.5) | 22 (7.3) | 0.2349 |
| Hematological | 28 (24.8) | 83 (27.7) | 0.6414 |
| Metabolic | 14 (12.4) | 68 (22.7) | 0.0281 |
| Neurological | 2 (1.8) | 29 (9.3) | 0.0152 |
| Number of organ failures | |||
| 1 | 73 (64.6) | 106 (35.3) | < 0.0001 |
| 2 | 30 (26.5) | 88 (29.3) | 0.6626 |
| 3 | 7 (6.2) | 59 (19.6) | 0.0015 |
| 4+ | 3 (2.7) | 47 (15.7) | 0.0006 |
| ICU admission, n (%) | 88 (77.9) | 270 (90) | 0.0020 |
| Procedures, n (%) | |||
| Mechanical ventilation | 45 (39.8) | 138 (46) | 0.3099 |
| Central venous catheterization | 31 (27.4) | 150 (50) | 0.0001 |
| Hemodialysis | 4 (3.5) | 18 (6) | 0.4552 |
| Hospital length of stay (days) | |||
| Mean (SD) | 14.7 (15.3) | 15.7 (21) | |
| Median (IQR) | 9 (6 - 19) | 9.5 (5.5 - 18) | 0.7939 |
| Hospital charges (dollars)c | |||
| Mean (SD) | 118,219 (145,240) | 191,503 (319,482) | |
| Median (IQR) | 64,034 (34,362 - 150,464) | 89,895 (43,614 - 218,357) | 0.0141 |
| Disposition, n (%) | |||
| Mortality | 11 (9.7) | 36 (12) | 0.6365 |
| Home | 80 (70.8) | 191 (63.7) | 0.2136 |
| Home care | 10 (8.8) | 30 (10) | 0.8683 |
| Another short-term facility | 8 (7.1) | 17 (5.7) | 0.5613 |
| Long-term care facility | 3 (2.7) | 14 (4.7) | 0.5224 |
| Otherd | 1 (0.9) | 10 (1.3) | 0.2412 |
| Mortality rate (per 105 TEP) | 1.1 | 3.3 | 0.0007 |
| Covariate | Adjusted odds ratio (95% CI)a | P value |
|---|---|---|
| a95% confidence interval. bAge < 35 years used as referent. cWhite race used as referent. dPoverty rate ≤ 20% used as referent; modeled only for pregnancy-associated hospitalizations with zip code data (that is, excluding those with a diagnosis of HIV infection, drug or alcohol abuse). ePrivate insurance used as referent; significant only when modeled without including poverty level (that is, without zip code data, and including pregnancy-associated hospitalizations with a diagnosis of HIV infection, drug or alcohol abuse). fBased on the Deyo-Charlson index. gHuman immunodeficiency virus. | ||
| Age ≥ 35 yearsb | 1.194 (0.989 - 1.442) | 0.0649 |
| Black racec | 1.354 (1.141 - 1.607) | 0.0005 |
| Poverty level > 20%d | 1.308 (1.125 - 1.520) | 0.0005 |
| No health insurancee | 1.255 (1.010 - 1.558) | 0.0403 |
| Smoking | 1.050 (0.653 - 1.689) | 0.8411 |
| Alcohol | 0.631 (0.193 - 2.068) | 0.4475 |
| Drug abuse | 3.365 (2.462 - 4.600) | < 0.0001 |
| Preeclampsia/eclampsia | 1.329 (1.052 - 1.679) | 0.0173 |
| Gestational diabetes | 0.542 (0.357 - 0.823) | 0.0040 |
| Obesity | 1.421 (1.011 - 1.996) | 0.0431 |
| Iron-deficiency anemia | 0.828 (0.578 - 1.187) | 0.3036 |
| Chronic co-morbiditiesf | ||
| Myocardial infarction | 11.023 (5.932 - 20.484) | < 0.0001 |
| Congestive heart failure | 20.485 (15.352 - 27.334) | < 0.0001 |
| Peripheral vascular disease | 2.847 (1.212 - 6.692) | 0.0164 |
| Cerebrovascular disease | 8.624 (4.710 - 15.792) | < 0.0001 |
| Chronic pulmonary disease | 1.773 (1.285 - 2.448) | 0.0005 |
| Connective tissue disease | 2.251 (1.210 - 4.187) | 0.0104 |
| Peptic ulcer disease | 6.500 (2.000 - 21.130) | 0.0019 |
| Chronic liver disease | 41.361 (31.531 - 54.266) | < 0.0001 |
| Diabetes | 1.771 (1.217 - 2.578) | 0.0028 |
| Chronic renal disease | 5.581 (3.582 - 9.559) | < 0.0001 |
| Malignancy | 4.669 (1.800 - 12.111) | 0.0015 |
| HIV infectiong | 4.248 (1.518 - 11.889) | 0.0059 |
| Covariate | Adjusted odds ratio (95% CI)a | P value |
|---|---|---|
| a95% confidence interval. bAge < 35 years used as referent. cPrivate insurance used as referent. dBased on the Deyo-Charlson index. eHuman immunodeficiency virus. fType and number of failing organs were modeled separately. gOne organ failure used as referent. | ||
| Age ≥ 35 yearsb | 1.595 (0.888 - 2.864) | 0.1185 |
| No health insurancec | 2.934 (1.464 - 5.880) | 0.0024 |
| Smoking | 0.391 (0.088 - 1.742) | 0.2512 |
| Drug abuse | 3.017 (1.278 - 7.122) | 0.0118 |
| Iron-deficiency anemia | 1.316 (0.263 - 6.593) | 0.7385 |
| Anemia | 0.329 (0.183 - 0.593) | 0.0002 |
| Preeclampsia/eclampsia | 1.063 (0.536 - 2.107) | 0.8616 |
| Stillbirth | 1.371 (0.407 - 4.622) | 0.6105 |
| Operative vaginal delivery | 1.589 (0.799 - 3.163) | 0.1868 |
| Hemorrhage | 1.171 (0.676 - 2.030) | 0.5726 |
| Chronic co-morbiditiesd | ||
| Myocardial infarction | 1.888 (0.594 - 6.006) | 0.2817 |
| Connective tissue disease | 2.509 (0.609 - 10.346) | 0.2031 |
| Chronic liver disease | 1.872 (0.942 - 3.317) | 0.0734 |
| Malignancy | 7.003 (0.898 - 54.624) | 0.0633 |
| Cerebrovascular disease | 1.455 (0.483 - 4.379) | 0.5047 |
| HIV infectione | 45.465 (5.180-399.031) | 0.0006 |
| Urinary tract infection | 0.300 (0.132 - 0.682) | 0.0041 |
| Genital tract infection | 0.806 (0.427 - 1.522) | 0.5056 |
| Organ failuresf | ||
| Respiratory | 2.577 (0.982 - 6.762) | 0.0545 |
| Cardiovascular | 1.909 (1.167 - 3.122) | 0.0100 |
| Renal | 1.727 (1.028 - 2.900) | 0.0388 |
| Hepatic | 1.892 (0.358 - 10.004) | 0.4531 |
| Hematological | 1.291 (0.731 - 2.278) | 0.3791 |
| Metabolic | 0.818 (0.459 - 1.457) | 0.4951 |
| Neurological | 1.637 (0.780 - 3.436) | 0.1927 |
| Number of organ failuresf, g | ||
| 2 | 1.536 (0.766 - 3.076) | 0.2265 |
| 3 | 3.827 (1.873 - 7.818) | 0.0002 |
| 4 | 2.895 (1.239 - 6.764) | 0.0141 |
| Mechanical ventilation | 4.540 (2.562 - 8.045) | < 0.0001 |
| Hemodialysis | 2.373 (1.126 - 5.000) | 0.0231 |
| Central venous catheterization | 1.254 (0.781 - 2.014) | 0.3496 |