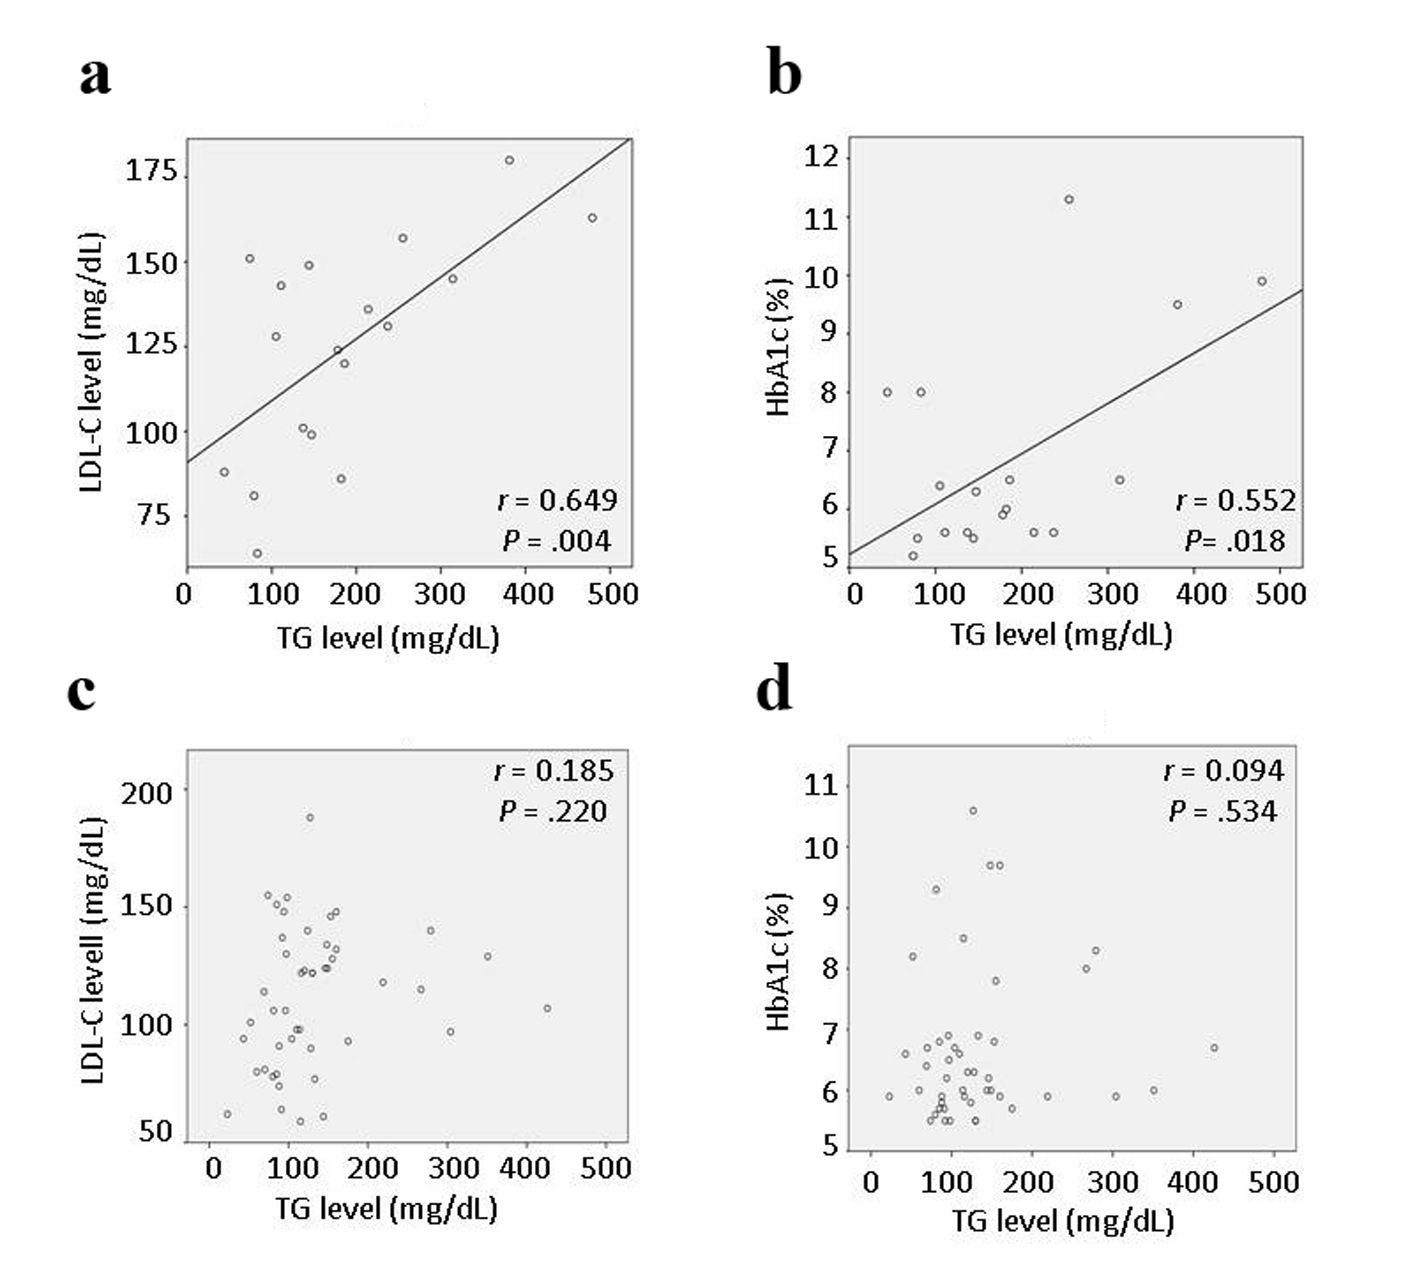
| Journal of Clinical Medicine Research, ISSN 1918-3003 print, 1918-3011 online, Open Access |
| Article copyright, the authors; Journal compilation copyright, J Clin Med Res and Elmer Press Inc |
| Journal website http://www.jocmr.org |
Original Article
Volume 7, Number 5, May 2015, pages 324-331
Cross-Sectional Study of Patients With Onset of Acute Coronary Syndrome During Statin Therapy
Figure

Tables
| < 1-year statin therapy (n = 18) | > 1-year statin therapy (n = 46) | P | |
|---|---|---|---|
| Values are n (%) or mean ± SD. *P < 0.05, **P < 0.01. BMI: body mass index; STEMI: ST-elevation myocardial infarction; NSTE-ACS: non-ST elevation acute coronary syndrome; CI: cerebral infarction; AF: atrial fibrillation; ARB: angiotensin-receptor blocker; ACEI: angiotensin-converting enzyme inhibitor. | |||
| Age (years) | 57.6 ± 11.9 | 76.6 ± 9.1** | < 0.001** |
| Male/female | 17/1 (94/6)* | 32/14 (70/30) | 0.030* |
| BMI | 27.22 ± 4.20* | 24.60 ± 4.65 | 0.016* |
| Disease type | |||
| STEMI | 9 (50) | 30 (65) | 0.262 |
| NSTE-ACS | 9 (50) | 16 (35) | 0.262 |
| Risk factors | |||
| Diabetes mellitus | 8 (44) | 22 (48) | 0.807 |
| Hypertension | 9 (50) | 34 (74) | 0.067 |
| Hyperuricemia | 3 (17) | 4 (9) | 0.305 |
| Hypertriglyceridemia | 4 (22) | 7 (15) | 0.370 |
| Current smoking | 11 (61)** | 8 (17) | 0.001** |
| Associated diseases | |||
| History of CI | 2 (11) | 20 (43)* | 0.014* |
| History of AF | 1 (6) | 6 (13) | 0.358 |
| Medications | |||
| Aspirin | 3 (17) | 26 (57)** | 0.004** |
| Clopidogrel | 0 (0) | 3 (7) | 0.364 |
| Ticlopidine | 0 (0) | 3 (7) | 0.364 |
| Warfarin | 1 (6) | 3 (7) | 0.687 |
| ARB/ACEI | 11 (61) | 27 (59) | 0.860 |
| β-blocker | 1 (6) | 7 (15) | 0.277 |
| Calcium antagonist | 3 (17) | 26 (57)** | 0.004** |
| Sulfonylurea | 3 (17) | 7 (15) | 0.579 |
| Insulin | 3 (17) | 8 (17) | 0.630 |
| Strong statins | 16 (89)** | 22 (48) | 0.003** |
| Atorvastatin | 3 (17) | 10 (22) | 0.470 |
| Pitavastatin | 5 (27) | 5 (11) | 0.101 |
| Rosuvastatin | 8 (44)* | 7 (15) | 0.018* |
| Standard statins | 2 (12) | 24 (52)** | 0.003** |
| Fluvastatin | 1 (6) | 7 (15) | 0.277 |
| Pravastatin | 1 (6) | 12 (26) | 0.061 |
| Simvastatin | 0 (0) | 5 (11) | 0.180 |
| Duration of statin therapy (years) | 0.61 ± 0.27** | 8.35 ± 4.65 | < 0.001** |
| < 1-year statin therapy (n = 18) | > 1-year statin therapy (n = 46) | P | |
|---|---|---|---|
| Values are n (%) or mean ± SD. *P < 0.05. HDL-C: high-density lipoprotein cholesterol; LDL-C: low-density lipoprotein cholesterol; TG: triglyceride; HbA1c: hemoglobin A1c; CRP: C-reactive protein; RCA: right coronary artery; LAD: left anterior descending branch; LCX: left circumflex branch; POBA: plain old balloon angioplasty. | |||
| Laboratory data | |||
| HDL-C (mg/dL) | 48.9 ± 8.8 | 49.1 ± 13.4 | 0.565 |
| LDL-C (mg/dL) | 124.8 ± 32.0 | 111.6 ± 29.5 | 0.122 |
| TG (mg/dL) | 186.1 ± 114.0 | 133.7 ± 79.4 | 0.064 |
| HbA1c (%) | 6.82 ± 1.78 | 6.65 ± 1.26 | 0.590 |
| Uric acid (mg/dL) | 5.81 ± 0.85* | 5.05 ± 1.17 | 0.016* |
| CRP (mg/dL) | 0.17 ± 0.14 | 0.21 ± 0.19 | 0.421 |
| Culprit lesion | |||
| RCA | 4 (22) | 14 (30) | 0.511 |
| LAD | 12 (67) | 20 (44) | 0.095 |
| LCX | 2 (11) | 12 (26) | 0.168 |
| % Stenosis | 88.4 ± 9.1 | 88.2 ± 7.4 | 0.828 |
| PCI procedure | |||
| POBA alone | 1 (6) | 3 (7) | 0.687 |
| Stenting | 17 (94) | 40 (86) | 0.358 |
| Bare-metal stent | 4 (22) | 11 (24) | 0.583 |
| Drug-eluting stent | 13 (72) | 29 (63) | 0.487 |
| Mean stent diameter (mm) | 3.23 ± 0.50 | 3.29 ± 0.44 | 0.693 |
| Mean stent length (mm) | 21.6 ± 5.8 | 20.7 ± 4.0 | 0.781 |
| Unsuccessful PCI | 0 (0) | 3 (7) | 0.364 |
| B: non-standardized regression coefficient; CI: confidence interval; β: standardized regression coefficient. | ||||
| Factors associated with LDL-C level | ||||
| Independent variable | B (95% CI) | β | t | P |
| TG | 0.18 (0.07 - 0.30) | 0.649 | 3.413 | 0.004 |
| Factors associated with HbA1c level | ||||
| Independent variable | B (95% CI) | β | t | P |
| TG | 0.009 (0.002 - 0.015) | 0.552 | 2.646 | 0.018 |
| < 1-year statin therapy (n = 17) | > 1-year statin therapy (n = 39) | P | |
|---|---|---|---|
| Values are n (%) or mean ± SD. *P < 0.05, **P < 0.01. HDL-C: high-density lipoprotein cholesterol; LDL-C: low-density lipoprotein cholesterol; TG: triglyceride; HbA1c: hemoglobin A1c; CRP: C-reactive protein. | |||
| BMI | 27.58 ± 4.40* | 24.65 ± 4.78 | 0.035* |
| HDL-C (mg/dL) | 52.0 ± 10.7 | 51.0 ± 14.0 | 0.605 |
| LDL-C (mg/dL) | 166.5 ± 25.1** | 115.9 ± 29.5 | < 0.001** |
| TG (mg/dL) | 186.3 ± 68.0 | 150.2 ± 98.3 | 0.175 |
| HbA1c (%) | 6.98 ± 2.15 | 6.50 ± 1.19 | 0.872 |
| Uric acid (mg/dL) | 5.75 ± 1.13* | 4.95 ± 1.09 | 0.015* |
| CRP (mg/dL) | 0.11 ± 0.08 | 0.22 ± 0.40 | 0.652 |