Journal of Clinical Medicine Research, ISSN 1918-3003 print, 1918-3011 online, Open Access
Article copyright, the authors; Journal compilation copyright, J Clin Med Res and Elmer Press Inc
Journal website http://www.jocmr.org

Original Article

Volume 7, Number 4, April 2015, pages 242-247


Protective Effects of Phosphocreatine Administered Post-Treatment Combined With Ischemic Post-Conditioning on Rat Hearts With Myocardial Ischemia/Reperfusion Injury

Figure

Figure 1.
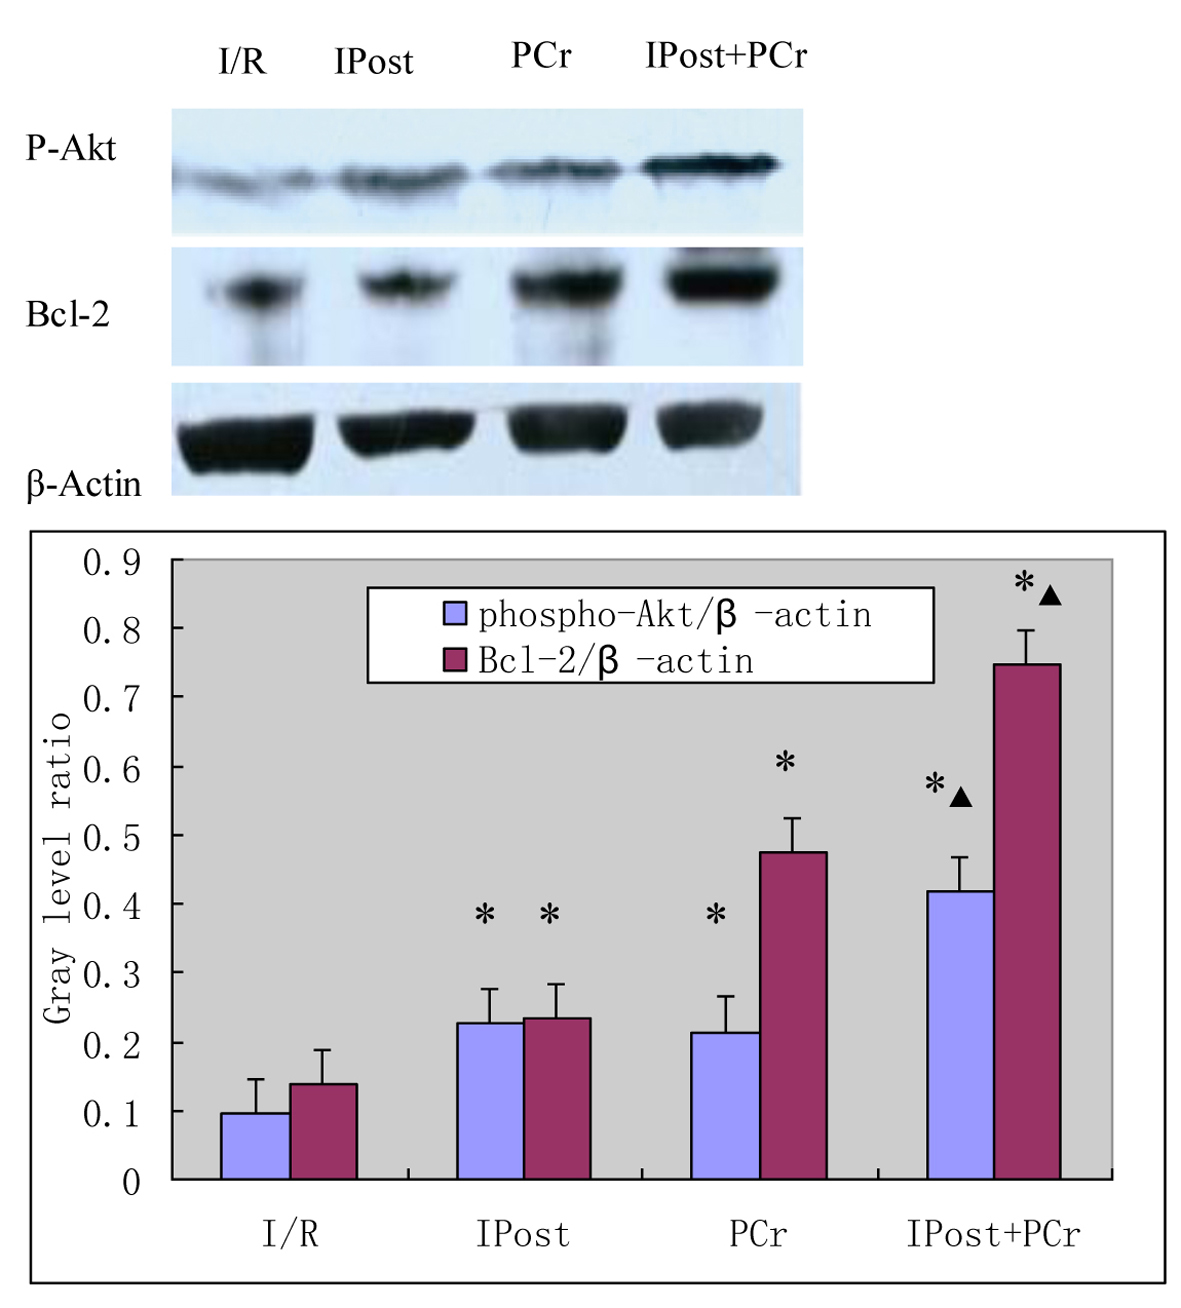
Figure 1. Results of western blot detection of left ventricular anterior ischemic myocardium p-Akt and Bcl-2 protein expression. The corresponding densitometric analysis is shown as a bar chart. *P < 0.05 vs. I/R group; ▲P < 0.05 vs. IPost group and PCr group.

Tables

Table 1. Comparison of Serum CK, LDH, and MPO in Each Experimental Group (x ± s, n = 10).
 
GroupCK (U/L)LDH (× 103 U/L)MPO (U/L)
*P < 0.05 vs. I/R group; †P < 0.05 vs. IPost group and PCr group.
I/R16.42 ± 2.745.21 ± 0.3473.16 ± 8.41
IPost8.74 ± 1.19*2.90 ± 0.14*37.48 ± 6.36*
PCr9.04 ± 1.42*2.80 ± 0.12*36.65 ± 3.71*
PCr + IPost5.79 ± 1.34*†1.85 ± 0.15*†19.92 ± 4.16*†


Table 2. Percentages of Risk Area and Infarct Size (x ± s, n = 7)
 
GroupBW (g)LV (g)AAR/LV (%)IS (%)
*P < 0.05 vs. I/R group; †P < 0.05 vs. IPost group and PCr group. BW: body weight; LV: left ventricle.
I/R278.24 ± 3.340.79 ± 0.0236.74 ± 5.1351.04 ± 3.88
IPost280.83 ± 11.120.80 ± 0.0535.62 ± 3.2238.27 ± 2.67*
PCr279.48 ± 6.790.79 ± 0.0635.40 ± 4.1835.78 ± 3.57*
PCr + IPost275.20 ± 8.560.78 ± 0.0324.85 ± 3.10*†18.52 ± 1.33*†


Table 3. Comparison of Serum NF-κB and TNF-α (x ± s, n = 7)
 
GroupNF-κB (ng/mL)TNF-α (pg/mL)
*P < 0.05 vs. I/R group; †P < 0.05 vs. IPost group and PCr group.
I/R67.98 ± 8.2234.95 ± 5.12
IPost40.92 ± 4.47*17.46 ± 1.97*
PCr16.81 ± 2.17*39.74 ± 2.77*
PCr + IPost26.23 ± 2.68*†10.83 ± 1.63*†