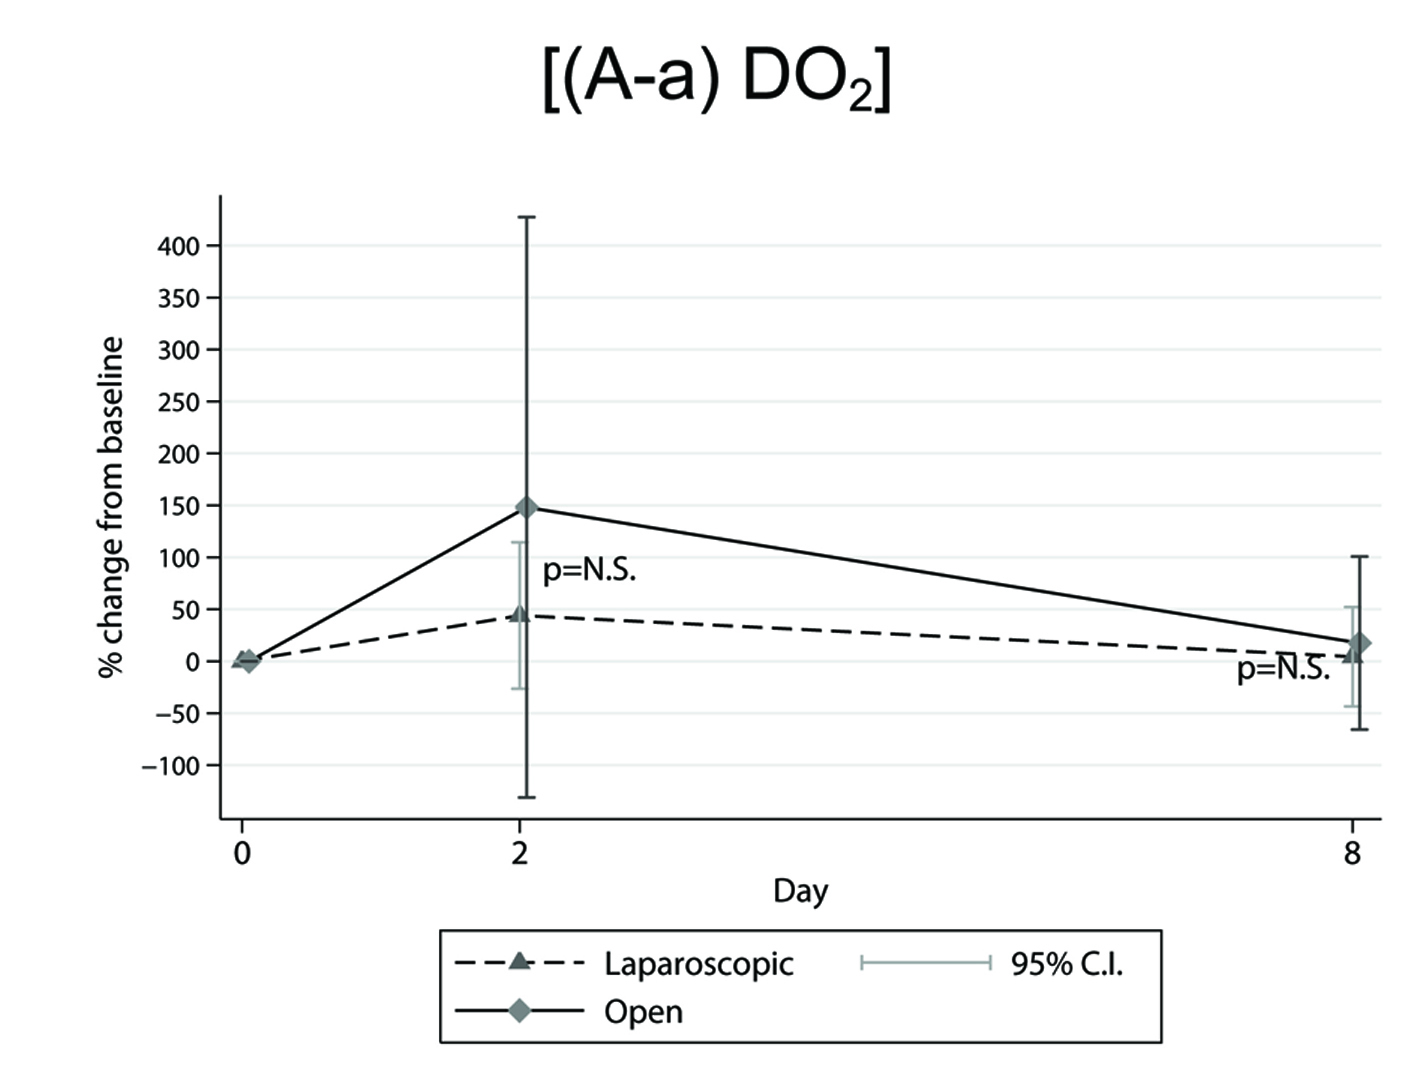
Figure 1. Mean percentage (%) changes in ((A-a)DO2) parameter, determined from preoperative level, in the across time measurements between laparoscopic and open cholecystectomy group.
| Journal of Clinical Medicine Research, ISSN 1918-3003 print, 1918-3011 online, Open Access |
| Article copyright, the authors; Journal compilation copyright, J Clin Med Res and Elmer Press Inc |
| Journal website http://www.jocmr.org |
Original Article
Volume 7, Number 4, April 2015, pages 232-241
Comparative Changes in Tissue Oxygenation Between Laparoscopic and Open Cholecystectomy
Figures
Tables
| Studied parameters | Preoperative value mean ± SD | Second postoperative day value mean ± SD | Changes from preoperative to second postoperative day mean ± SEM (95% CI), % | Eighth postoperative day value mean ± SD | Changes from preoperative to eighth postoperative day mean ± SEM (95% CI), % |
|---|---|---|---|---|---|
| *Values in pH, PaO2 mm Hg and PaCO2 mm Hg have been numerically reported in a previous work [18]. | |||||
| (A-a)DO2, kPa (mm Hg) | 3.428 ± 1.458 (25.71 ± 10.94) | 3.773 ± 1.357 (28.30 ± 10.18) | 44.0493 ± 32.6119 (-26.404, 114.503) | 2.781 ± 1.296 (20.86 ± 9.72) | 4.3974 ± 22.1251 (-43.401, 52.196) |
| HCO3-, mEq/L | 24.14 ± 1.10 | 25.09 ± 2.11 | 6.445 ± 0.697 (1.30, 11.59) | 24.47 ± 1.45 | 3.474 ± 1.001 (-3.22, 10.17) |
| SaO2% | 94.93 ± 2.11 | 94.93 ± 1.83 | -0.2357 ± 0.2087 (-1.778, 1.307) | 95.82 ± 2.47 | 1.097 ± 0.5786 (-2.773, 4.967) |
| Oct in vol% | 17.55 ± 1.90 | 15.69 ± 1.88 | -10.71 ± 1.34 (-20.62, -0.80) | 15.98 ± 1.73 | -7.095 ± 1.632 (-18.01, 3.82) |
| pH | 7.41 ± 0.03 | 7.43 ± 0.03 | 0.2747 ± 0.1072 (0.044, 0.507) | 7.43 ± 0.03 | 0.1825 ± 0.1348 (-0.109, 0.474) |
| PaO2, kPa (mm Hg) | 10.521 ± 2.322 (78.91 ± 17.42) | 9.988 ± 1.586 (74.71 ± 11.90) | - 3.6965 ± 3.4823 (-11.219, 3.827) | 10.96 ± 1.492 (82.20 ± 11.19) | 7.7561 ± 6.4765 (-6.236, 21.748) |
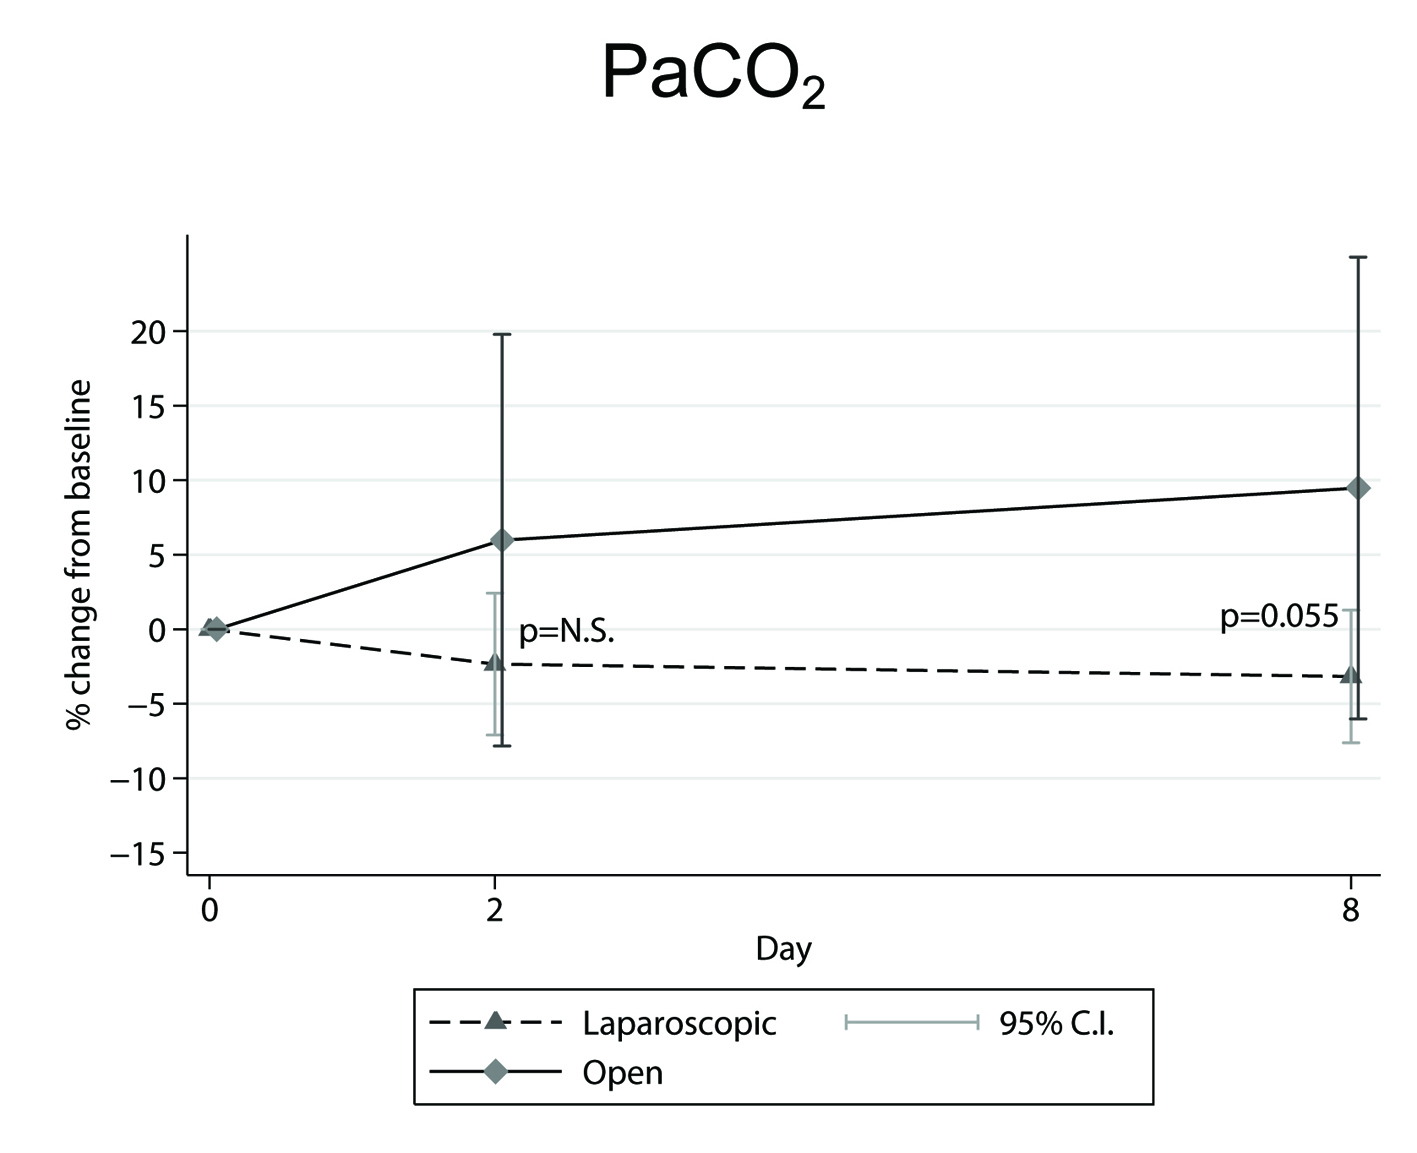
| PaCO2, kPa (mm Hg) | 5.112 ± 0.308 (38.34 ± 2.31) | 4.984 ± 0.413 (37.38 ± 3.10) | - 2.3400 ± 2.2046 (-7.103, 2.423) | 4.94 ± 0.370 (37.05 ± 2.78) | - 3.1716 ± 2.0601 (-7.622, 1.279) |
| Studied parameters | Preoperative value mean ± SD | Second postoperative day value mean ± SD | Changes from preoperative to second postoperative day mean ± SEM (95% CI), % | Eighth postoperative day value mean ± SD | Changes from preoperative to eighth postoperative day mean ± SEM (95% CI), % |
|---|---|---|---|---|---|
| *Values in pH, PaO2 mm Hg and PaCO2 mm Hg have been numerically reported in a previous work [18]. | |||||
| (A-a)DO2, kPa (mm Hg) | 3.776 ± 1.949 (28.32 ± 14.62) | 4.673 ± 0.966 (35.05 ± 7.25) | 148.1581 ± 123.4195 (-131.04, 427.35) | 2.857 ± 1.556 (21.43 ± 11.67) | 17.5287 ± 36.7968 (-65.71, 100.77) |
| HCO3-, mEq/L | 24.19 ± 3.97 | 25.71 ± 1.72 | 8.159 ± 3.151 (-12.92, 29.23) | 25.01 ± 1.19 | 8.540 ± 3.343 (-13.10, 30.18) |
| SaO2% | 95.34 ± 2.19 | 93.6 ± 1.41 | -1.8307 ± 0.1626 (-2.918, -0.7433) | 94.99 ± 2.66 | -0.2117 ± 0.5607 (-3.8415, 3.4179) |
| Oct in vol% | 16.99 ± 2.37 | 14.62 ± 2.23 | -11.31 ± 2.318 (-26.81, 4.19) | 16.10 ± 2.38 | 0.248 ± 3.109 (-19.88, 20.37) |
| pH | 7.44 ± 0.02 | 7.44 ± 0.03 | 0.07508 ± 0.1091 (-0.171, 0.323) | 7.42 ± 0.03 | -0.1938 ± 0.1207 (-0.466, 0.080) |
| PaO2, kPa (mm Hg) | 10.244 ± 2.025 (76.83 ± 15.19) | 9.086 ± 1.004 (68.15 ± 7.53) | - 8.9566 ± 5.4844 (-21.363, 3.450) | 10.5 ± 1.617 (78.75 ± 12.13) | 6.4946 ± 8.3616 (12.421, 25.410) |
| PaCO2, kPa (mm Hg) | 4.921 ± 0.785 (36.91 ± 5.89) | 5.094 ± 0.337 (38.21 ± 2.53) | 5.9747 ± 6.1044 (-7.834, 19.784) | 5.252 ± 0.332 (39.39 ±2.49) | 9.4777 ± 6.8491 (-6.016, 24.971) |