Figures
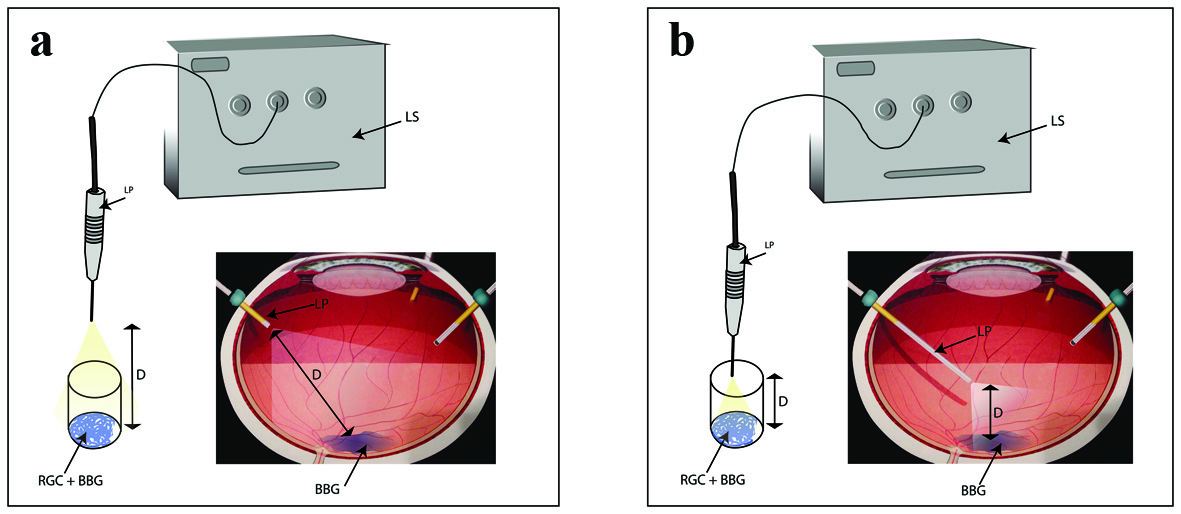
Figure 1. Schematic representation explaining the exposure of RGCs to BBG during intraocular surgery as well as cell culture setup. (a) Diffuse light illumination. (b) Focal illumination. LS: light source; LP: light pipe; D: distance; RGC: retinal ganglion cell; BBG: brilliant blue green.
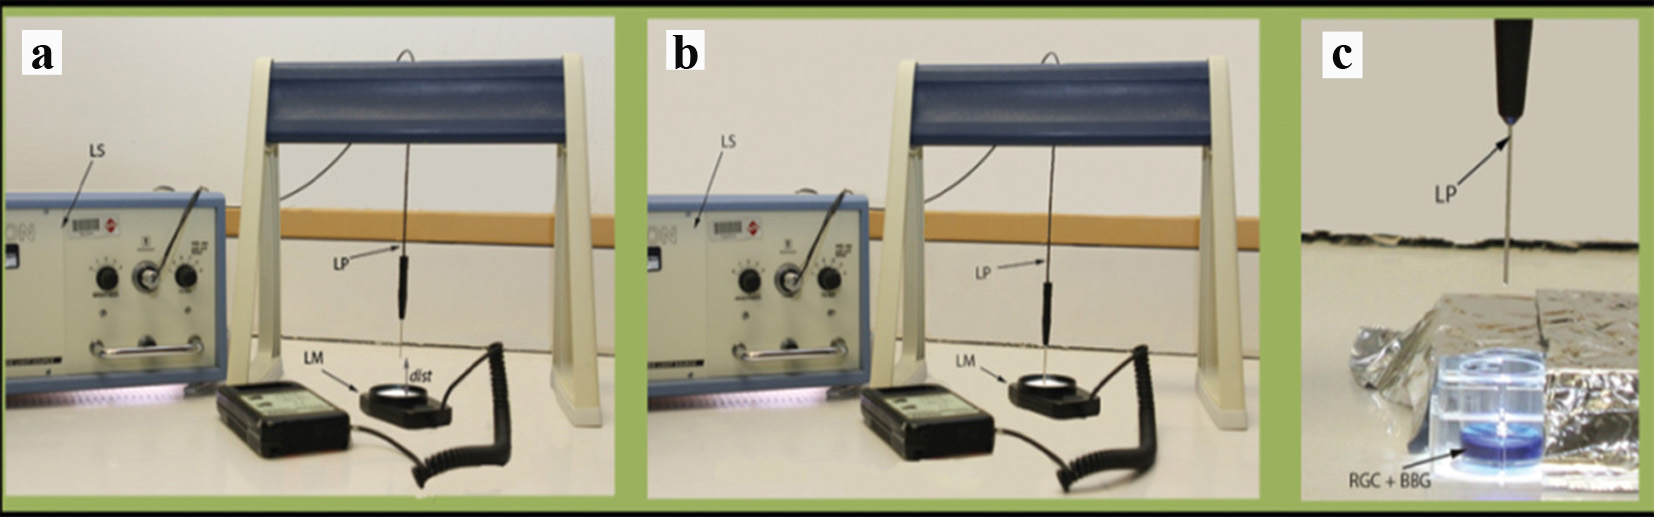
Figure 2. Experimental illustration. (a) Measurement of metal halide light illumination using a light meter at a certain distance from the light source. (b) Measurement of metal halide light illumination using a light meter directly from the light source. (c) Exposure of cultured RGCs to metal halide illumination. LS: light source; LP: light pipe; LM: light meter; dist: distance; RGC: retinal ganglion cell; BBG: brilliant blue green.
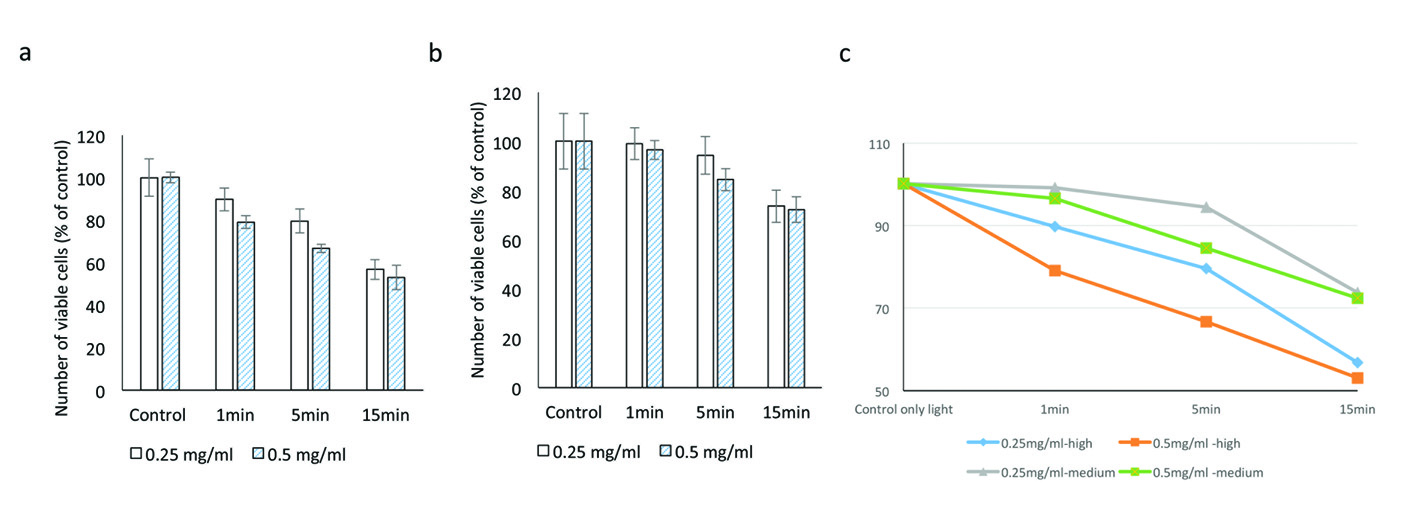
Figure 3. Evaluating the cytotoxic effect of brilliant blue green at 1 cm metal halide distance illumination on retinal ganglion cells using WST-1 assay at high (a) and medium illumination (b). X-axis represents the time dependent exposure in minutes; Y-axis represents number of viable cells expressed as percent of control (N = 4); (c) represents the trend line.
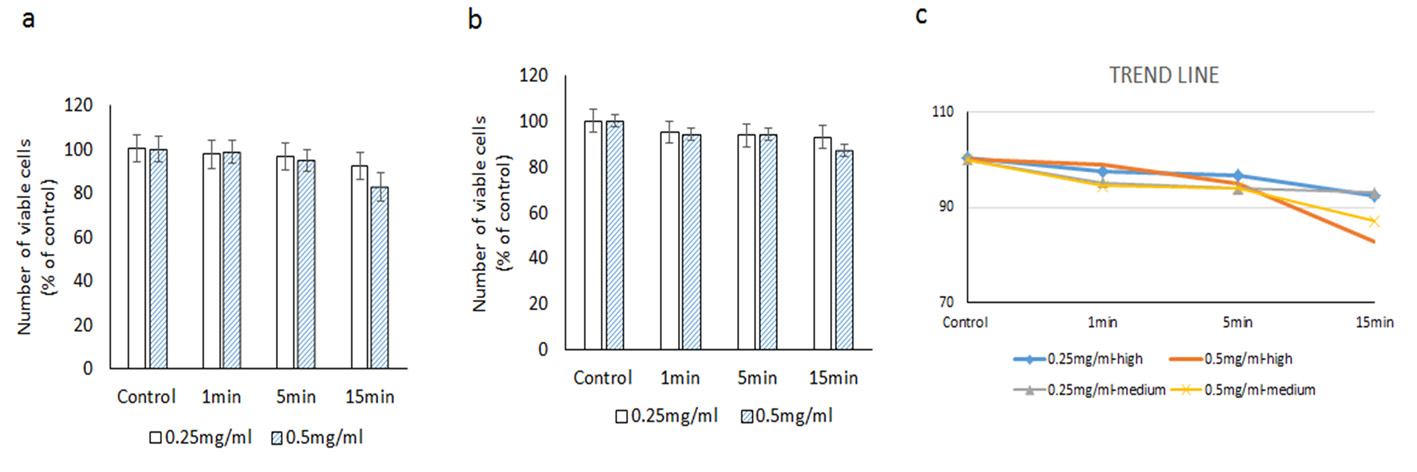
Figure 4. Evaluating the cytotoxic effect of brilliant blue green at 2.5 cm metal halide distance illumination on retinal ganglion cells using WST-1 assay at high (a) and medium illumination (b). X-axis represents the time dependent exposure in minutes; Y-axis represents number of viable cells expressed as percent of control (N = 4); (c) represents the trend line.
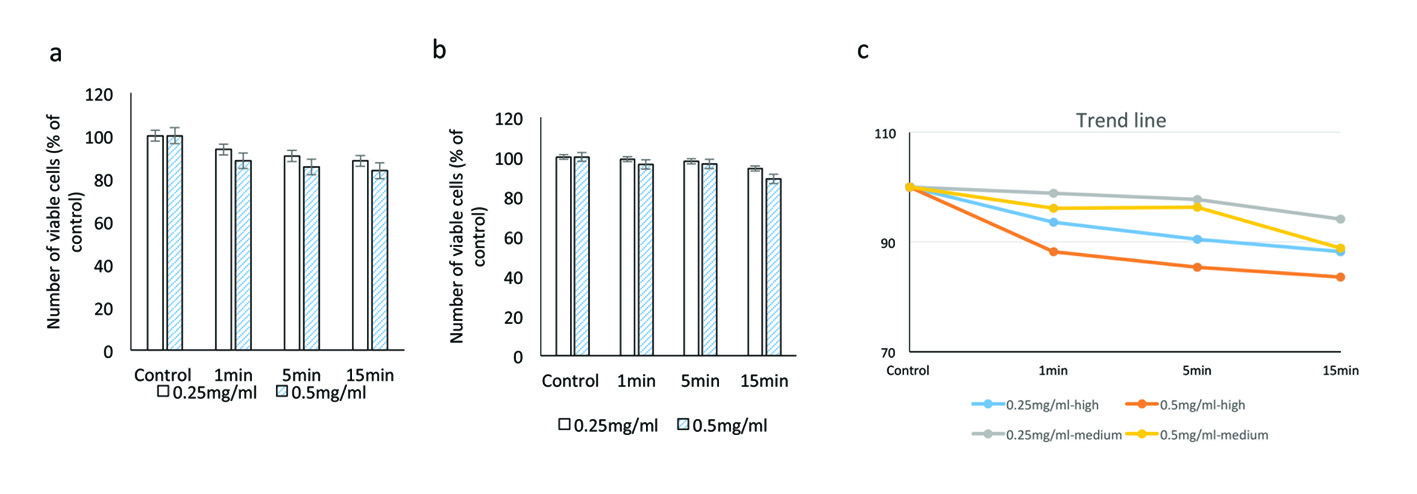
Figure 5. Evaluating the cytotoxic effect of brilliant blue green at 1 cm metal halide distance illumination on retinal ganglion cells using CellTiter 96® AQueous One proliferation assay at high (a) and medium illumination (b). X-axis represents the time dependent exposure in minutes; Y-axis represents number of viable cells expressed as percent of control (N = 4); (c) represents the trend line.
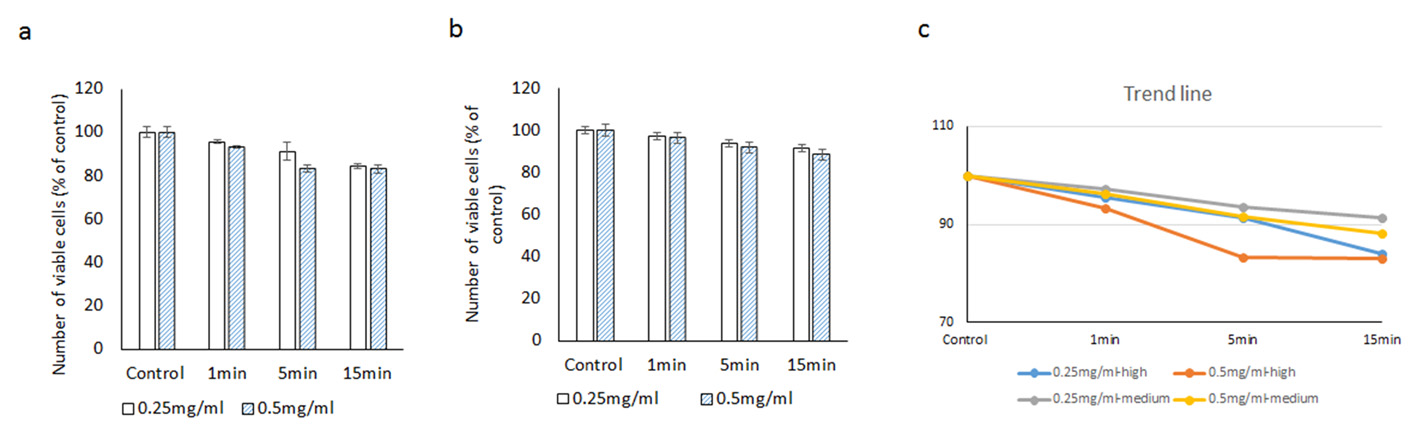
Figure 6. Evaluating the cytotoxic effect of brilliant blue green at 2.5 cm metal halide distance illumination on retinal ganglion cells using CellTiter 96® AQueous One proliferation assay at high (a) and medium illumination (b). X-axis represents the time dependent exposure in minutes; Y-axis represents number of viable cells expressed as percent of control (N = 4); (c) represents the trend line.
Tables
Table 1. Viability of RGCs After Illumination at 1 cm and 2.5 cm Distance With Higher and Medium Illumination of Metal Halide Light Source Using the WST-1 Assay
| Distance of illumination (cm) | Concentration of dye (mg/mL) | Higher illumination cell viability ± SD (%) | Medium illumination cell viability ± SD (%) |
|---|
| 1 min | 5 min | 15 min | 1 min | 5 min | 15 min |
|---|
| 1 | 0.25 | 89.8 ± 7.4 | 79.6 ± 4.9 | 56.7 ± 4.0 | 99.1 ± 14.5 | 94.4 ± 18.8 | 73.7 ± 16.0 |
| 0.5 | 79 ± 13.1 | 66.7 ± 13.6 | 53.1 ± 11.3 | 96.5 ± 8.5 | 84.5 ± 11.0 | 72.3 ± 12.8 |
| 2.5 | 0.25 | 97.5 ± 16.4 | 96.7 ± 15.2 | 92.4 ± 15.2 | 95.1 ± 7.2 | 93.8 ± 7.2 | 93.0 ± 1.8 |
| 0.5 | 98.9 ± 12.6 | 94.8 ± 12.4 | 82.7 ± 15.7 | 94.5 ± 3.9 | 94.0 ± 2.9 | 87.0 ± 7.0 |
Table 2. Viability of RGCs After Illumination at 1 cm and 2.5 cm Distance With Higher and Medium Illumination of Metal Halide Light Source Using the CellTiter 96® AQueous One Assay
| Distance of illumination (cm) | Concentration of dye (mg/mL) | Higher illumination cell viability ± SD (%) | Medium illumination cell viability ± SD (%) |
|---|
| 1 min | 5 min | 15 min | 1 min | 5 min | 15 min |
|---|
| 1 | 0.25 | 93.5 ± 5.3 | 90.4 ± 3.1 | 88.2 ± 6.7 | 98.9 ± 6.5 | 97.8 ± 7.9 | 94.2 ± 4.8 |
| 0.5 | 88.2 ± 5.5 | 85.3 ± 7.9 | 83.6 ± 4.1 | 96.2 ± 8.1 | 96.4 ± 5.9 | 88.9 ± 7.1 |
| 2.5 | 0.25 | 95.6 ± 1.8 | 91.2 ± 3.2 | 84 ± 2.3 | 97.2 ± 7.6 | 93.7 ± 8.6 | 91.4 ± 7.9 |
| 0.5 | 93.3 ± 1.3 | 83.2 ± 2.0 | 83.1 ± 2.8 | 96.3 ± 8.5 | 91.6 ± 6.9 | 88.2 ± 7.8 |