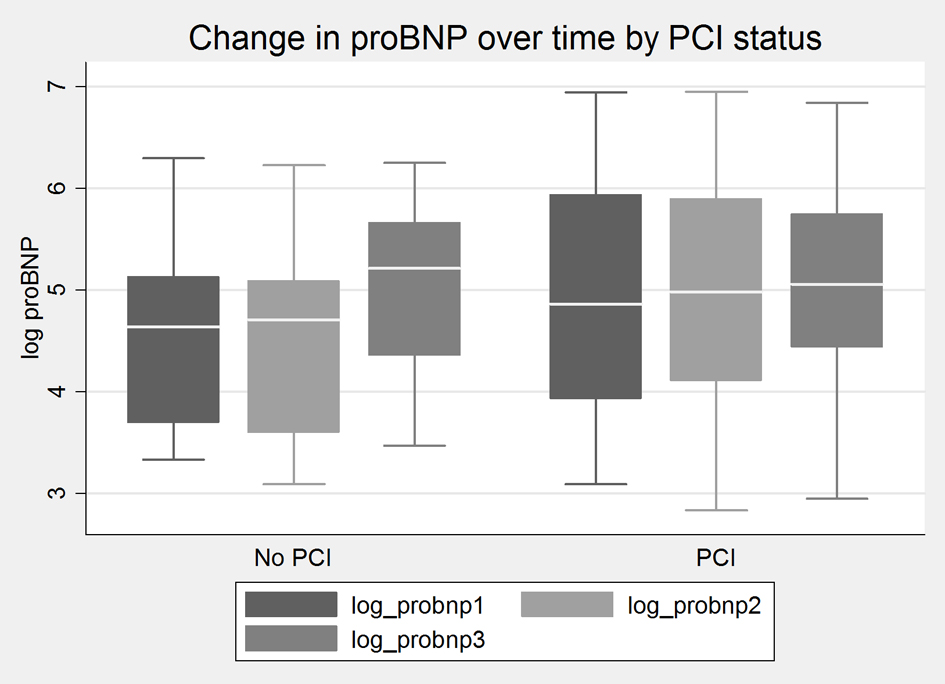
Figure 1. Change in proBNP level over time in PCI and DCA (no PCI) groups. Log values are used to impart data normality.
| Journal of Clinical Medicine Research, ISSN 1918-3003 print, 1918-3011 online, Open Access |
| Article copyright, the authors; Journal compilation copyright, J Clin Med Res and Elmer Press Inc |
| Journal website http://www.jocmr.org |
Original Article
Volume 7, Number 7, July 2015, pages 506-510
Plasma ProBNP Is Not a Specific Marker for Transient Myocardial Ischemia
Figure
Tables
| Characteristics | DCA group | PCI group | P value |
|---|---|---|---|
| NS: non-significant; DCA: diagnostic coronary angiography; PCI: percutaneous coronary intervention. | |||
| Number of patients (n = 49) | 22 | 27 | NS |
| Age (mean ± SD) | 60 ± 11.1 | 61 ± 12.5 | NS |
| Gender (% female) | 45 | 33 | NS |
| LV EF % (mean ± SD) | 61.3 ± 7.7 | 57 ± 5.6 | 0.04 |
| LVEDP (mean ± SD) | 16 ± 5.2 | 18 ± 5.6 | NS |
| Hypertension (%) | 63.6 | 66.6 | NS |
| Diabetes mellitus (%) | 22.7 | 14.8 | NS |
| Hyperlipidemia | 59 | 59.2 | NS |
| Active smokers (%) | 4 | 11 | NS |
| BUN (mean ± SD) | 18.4 ± 5.2 | 15.8 ± 6.3 | NS |
| Serum creatinine (mean ± SD) | 0.94 ± 0.22 | 0.94 ± 0.3 | NS |
| Beta-blocker (%) | 72 | 77 | NS |
| ACE inhibitor/ARB (%) | 31.8 | 48.1 | NS |
| Statin (%) | 59 | 59.2 | NS |
| Diuretics (%) | 22.7 | 29.6 | NS |
| Contrast (mean ± SD) | 132 cc ± 43.4 | 234 cc ± 124.8 | 0.003 |
| Mean proBNP-1 (pg/mL) | Mean proBNP-2 (pg/mL) | Mean proBNP-3 (pg/mL) | P value | |
|---|---|---|---|---|
| DCA group | 131.15 ± 122.17 | 129.13 ± 114.76 | 198.9 ± 136.67 | NS |
| PCI group | 225.17 ± 258.3 | 223.34 ± 250 | 241.5 ± 234.1 | NS |