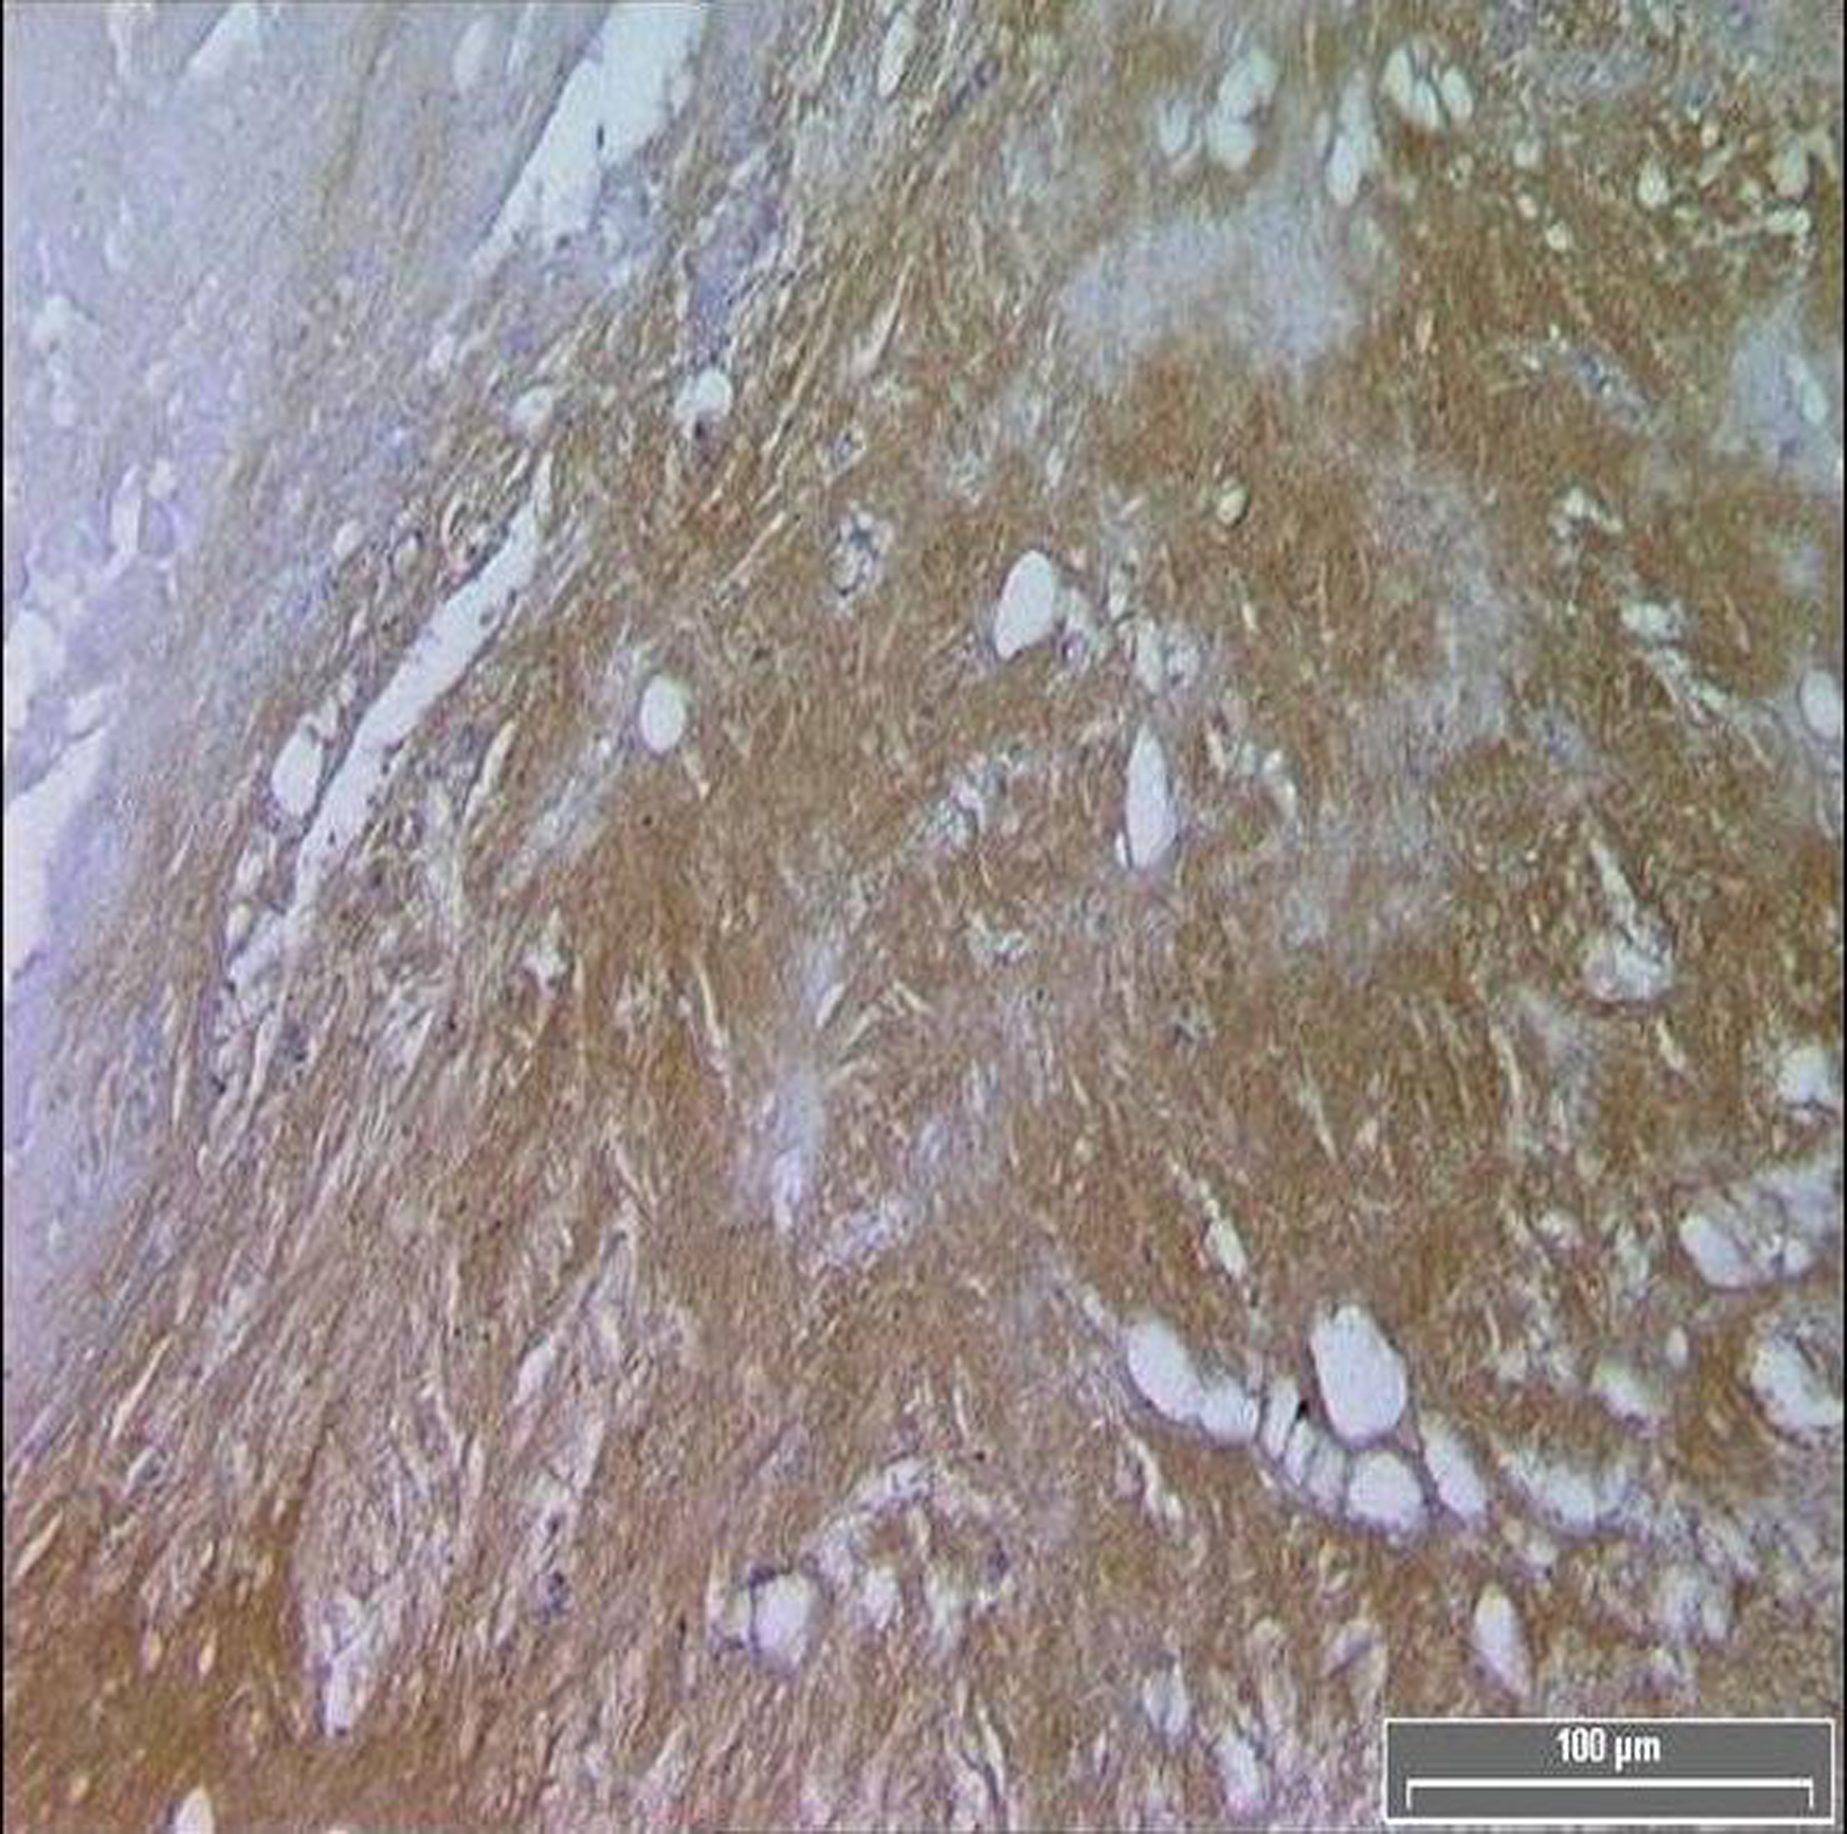
Figure 1. Diffuse TF immuno-reactivity in the core of a symptomatic patient.
| Journal of Clinical Medicine Research, ISSN 1918-3003 print, 1918-3011 online, Open Access |
| Article copyright, the authors; Journal compilation copyright, J Clin Med Res and Elmer Press Inc |
| Journal website http://www.jocmr.org |
Original Article
Volume 1, Number 3, August 2009, pages 137-143
Tissue Factor Expression in the Symptomatic Carotid Plaque
Figures
Tables
| Age (mean ± SD) | Sex (Male) | |
|---|---|---|
| All Patients (n=37) | 69 ± 7 | 27 |
| Asymptomatic (n=4) | 72 ± 4 | 1 |
| Symptomatic (n=33) | 69 ± 9 | 26 |
| Time Since Symptoms | Number | Sex (Male) |
| Asymptomatic | 4 | 1 |
| 1-6 Months | 17 | 16 |
| < 1 Month | 16 | 10 |
| Type of Symptoms | Number | Sex (Male) |
| Asymptomatic | 4 | 1 |
| TIA/AF | 26 | 5 |
| Stroke | 7 | 21 |
| Asymptomatic | Symptomatic | P Value | |
|---|---|---|---|
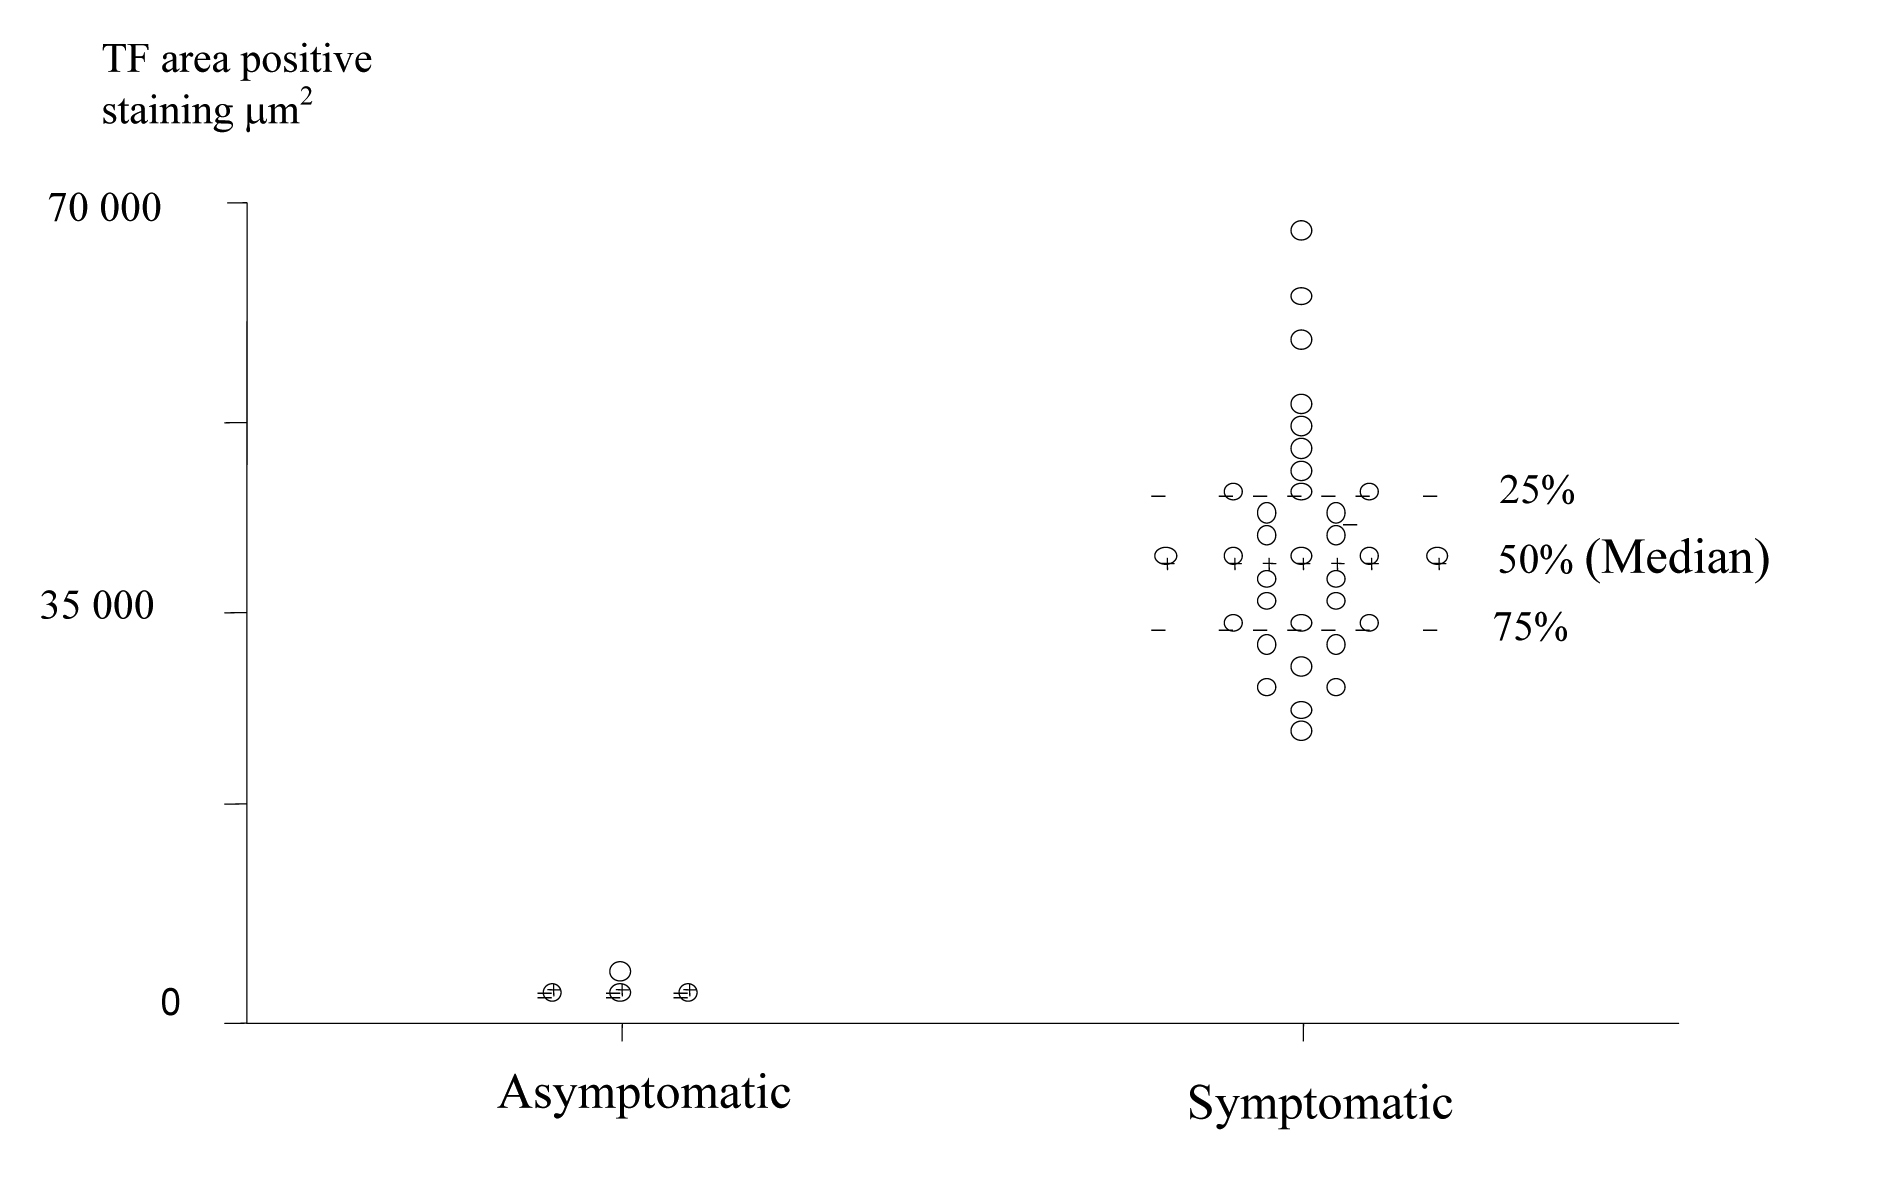
| TF Cap | 379.1 [301.4-703.2] | 37296.2 [32067.6-43648.7] | 0.0010 |
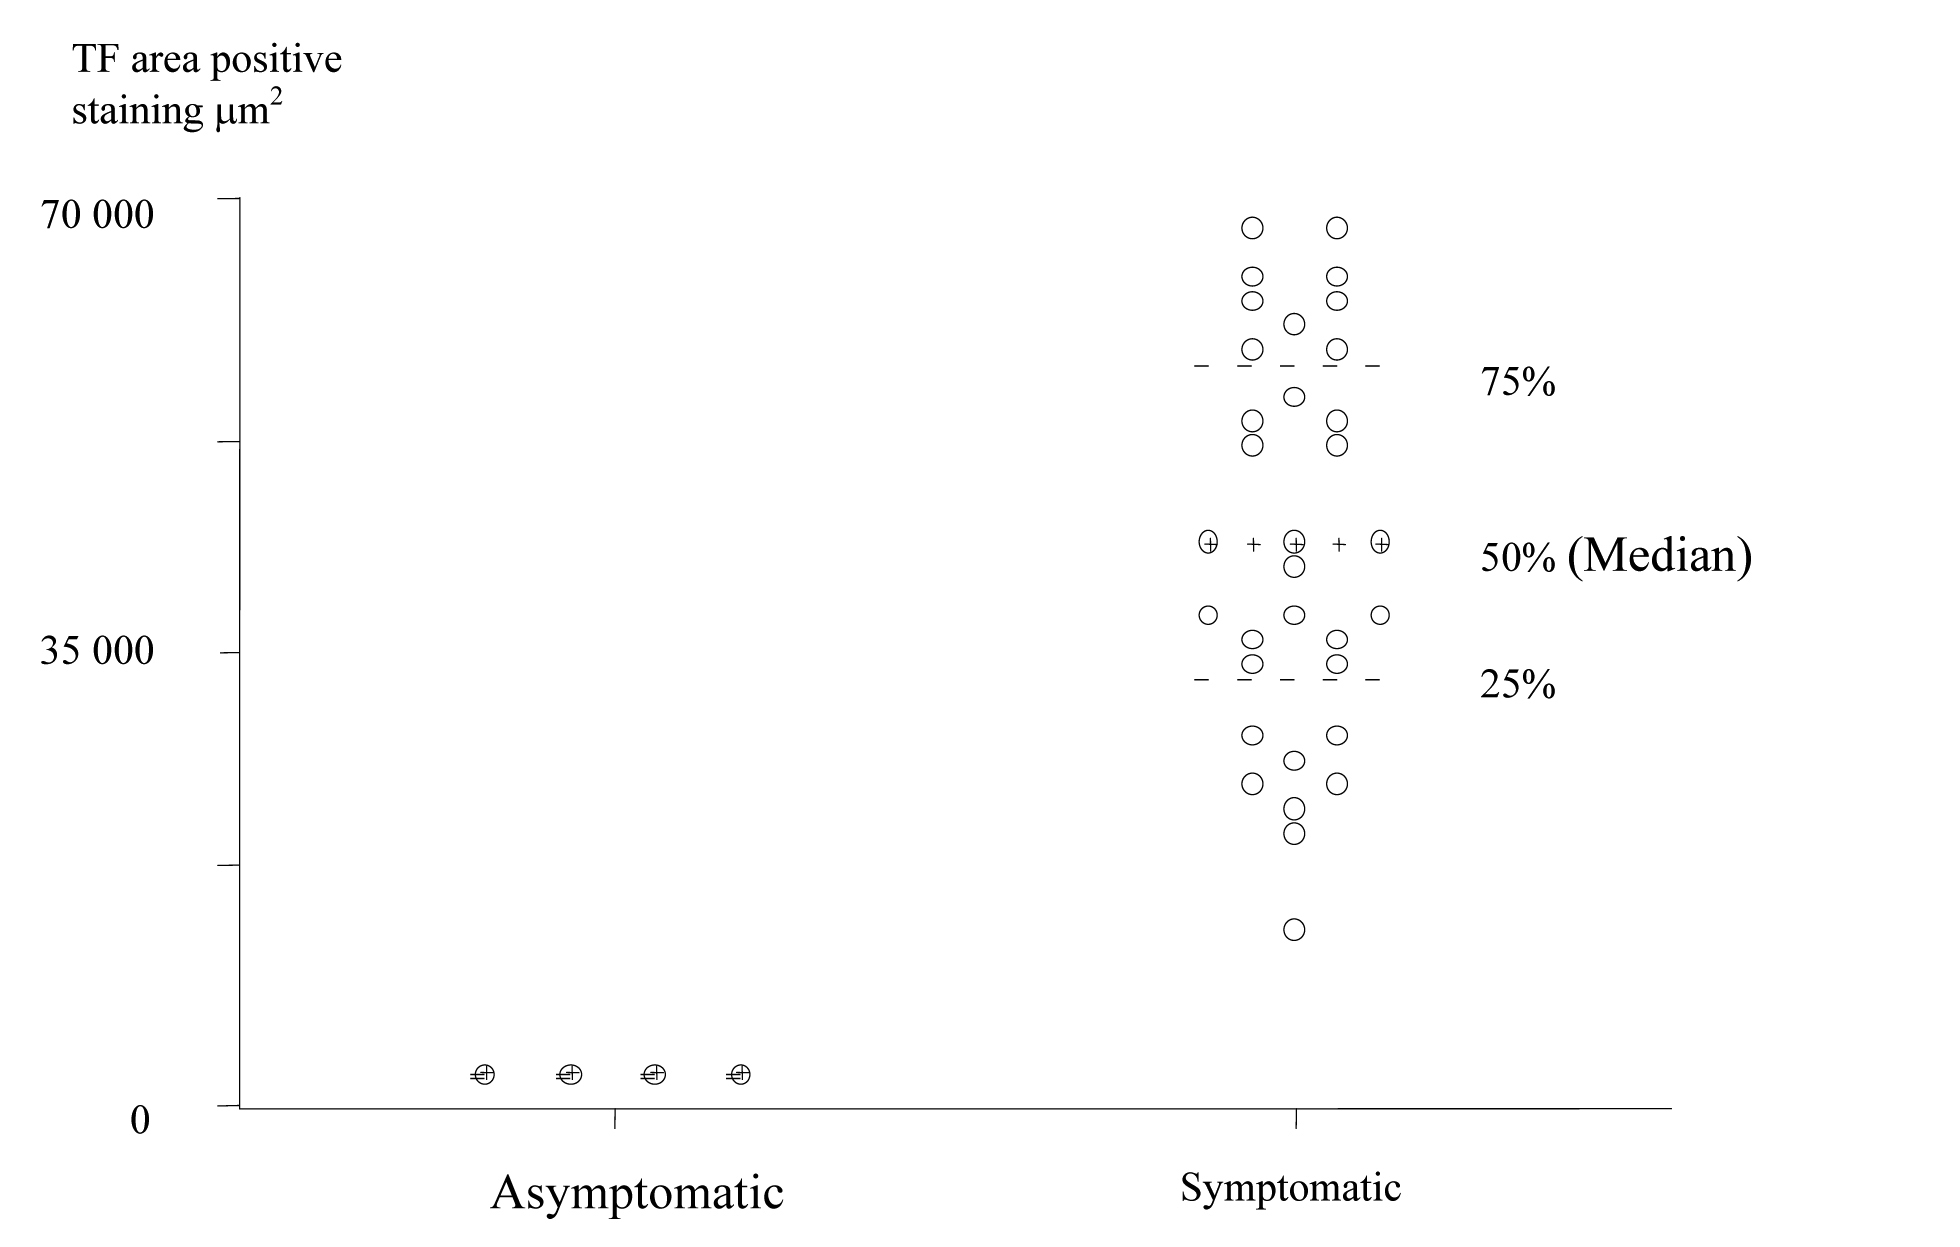
| TF Core | 399.8 [282.2-710.4] | 52689.2 [39798.5-70827.0] | 0.0010 |
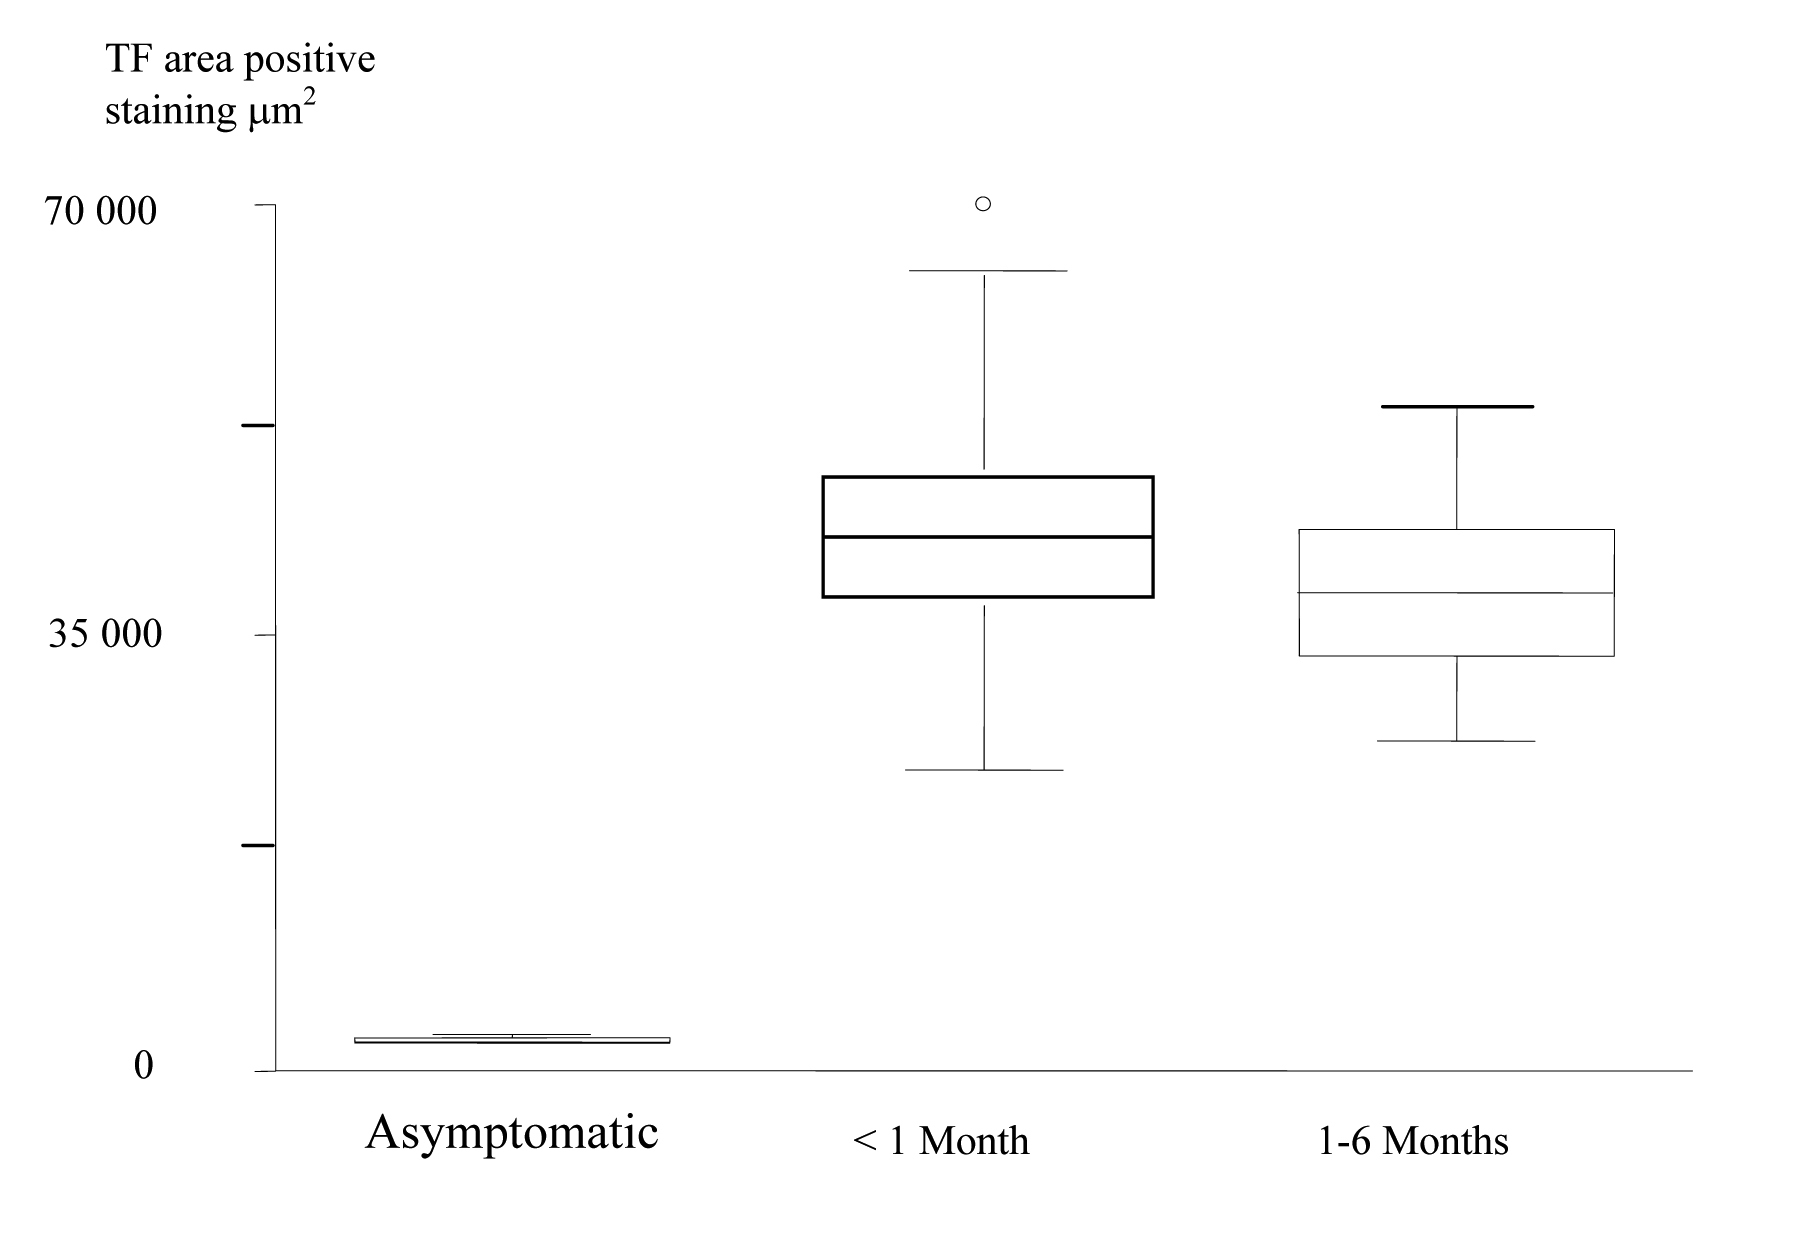
| Asymptomatic | < 1 Month | 1-6 Months | P Value | |
|---|---|---|---|---|
| TF Core | 399.8 [282.2-710.4] | 64386.2 [38320.6-75970.5] | 46286.7 [39698.5-63462.7] | 0.0030 |