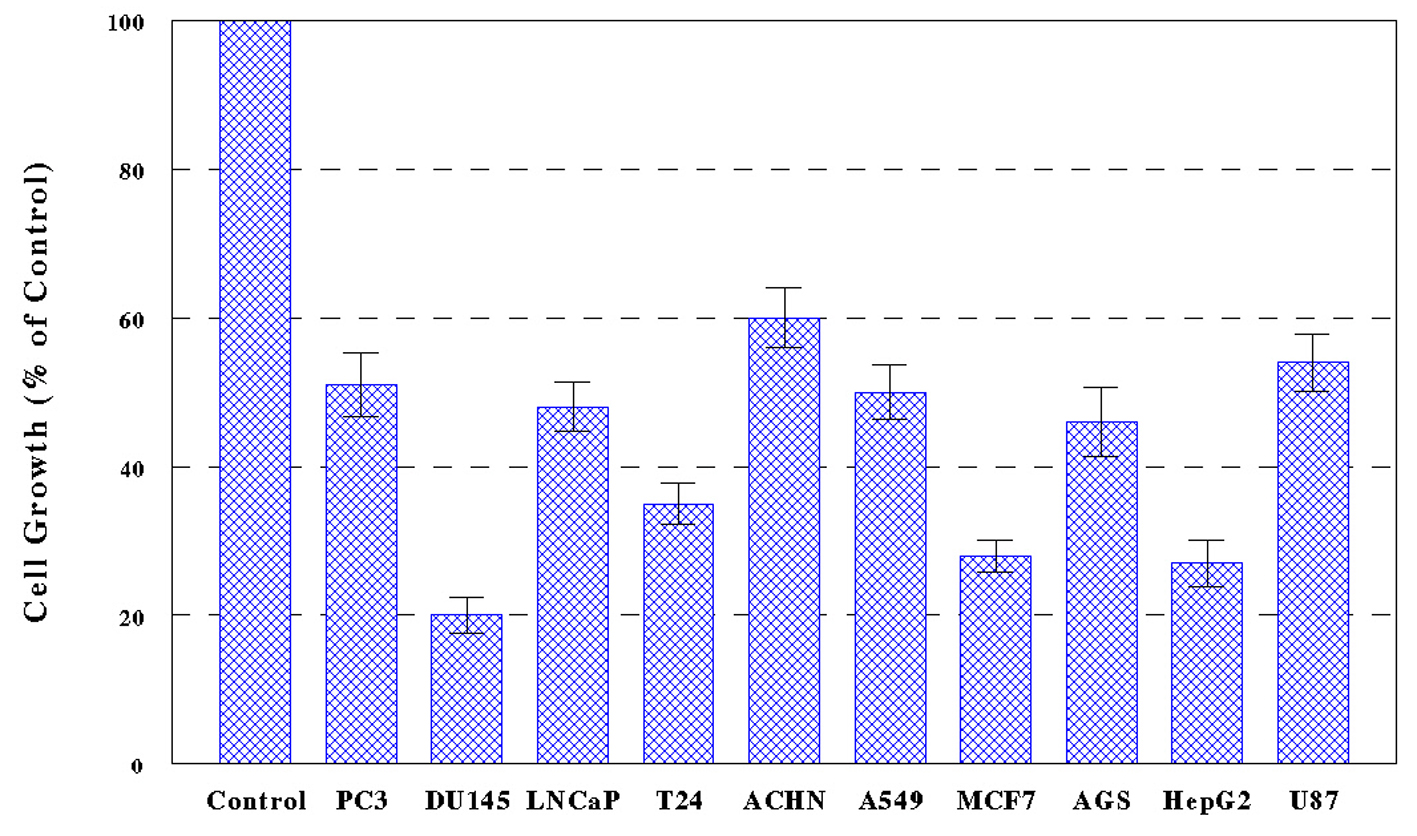
Figure 1. Effects of PL-ES on cell growth. Ten cancer cell lines, PC-3, DU-145, LNCaP, T24, ACHN, A549, MCF-7, AGS, HepG2, and U-87, were cultured with PL-ES (100 µg/mL) for 72 h and cell growth was assessed by MTT assay as described in Materials and Methods. Cell growth was expressed by the percent (%) of the reading of viable cells relative to controls (100%). Differences in cell growth between control and all treated cells are statistically significant (P < 0.05). All data are mean ± standard deviation (SD) from three separate experiments.
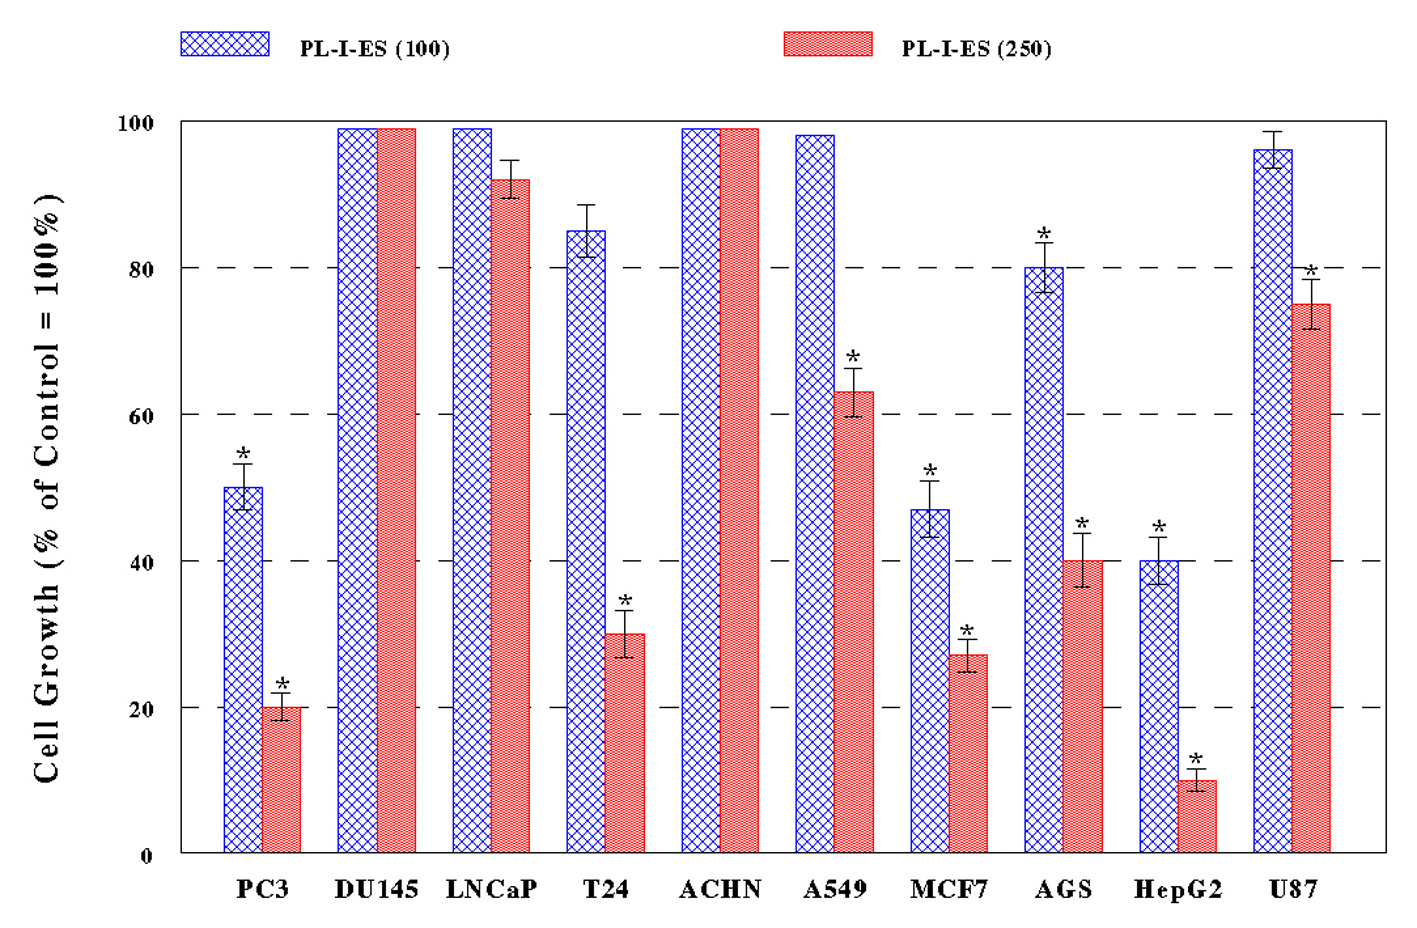
Figure 2. Effects of PL-I-ES on cell growth. Ten different cancer cells were cultured with PL-I-ES at either 100 or 250 µg/mL for 72 h and cell growth was determined by MTT assay. Cell growth was expressed by the percent (%) relative to controls (100%) (*P < 0.05). The data are mean ± SD from three independent experiments.
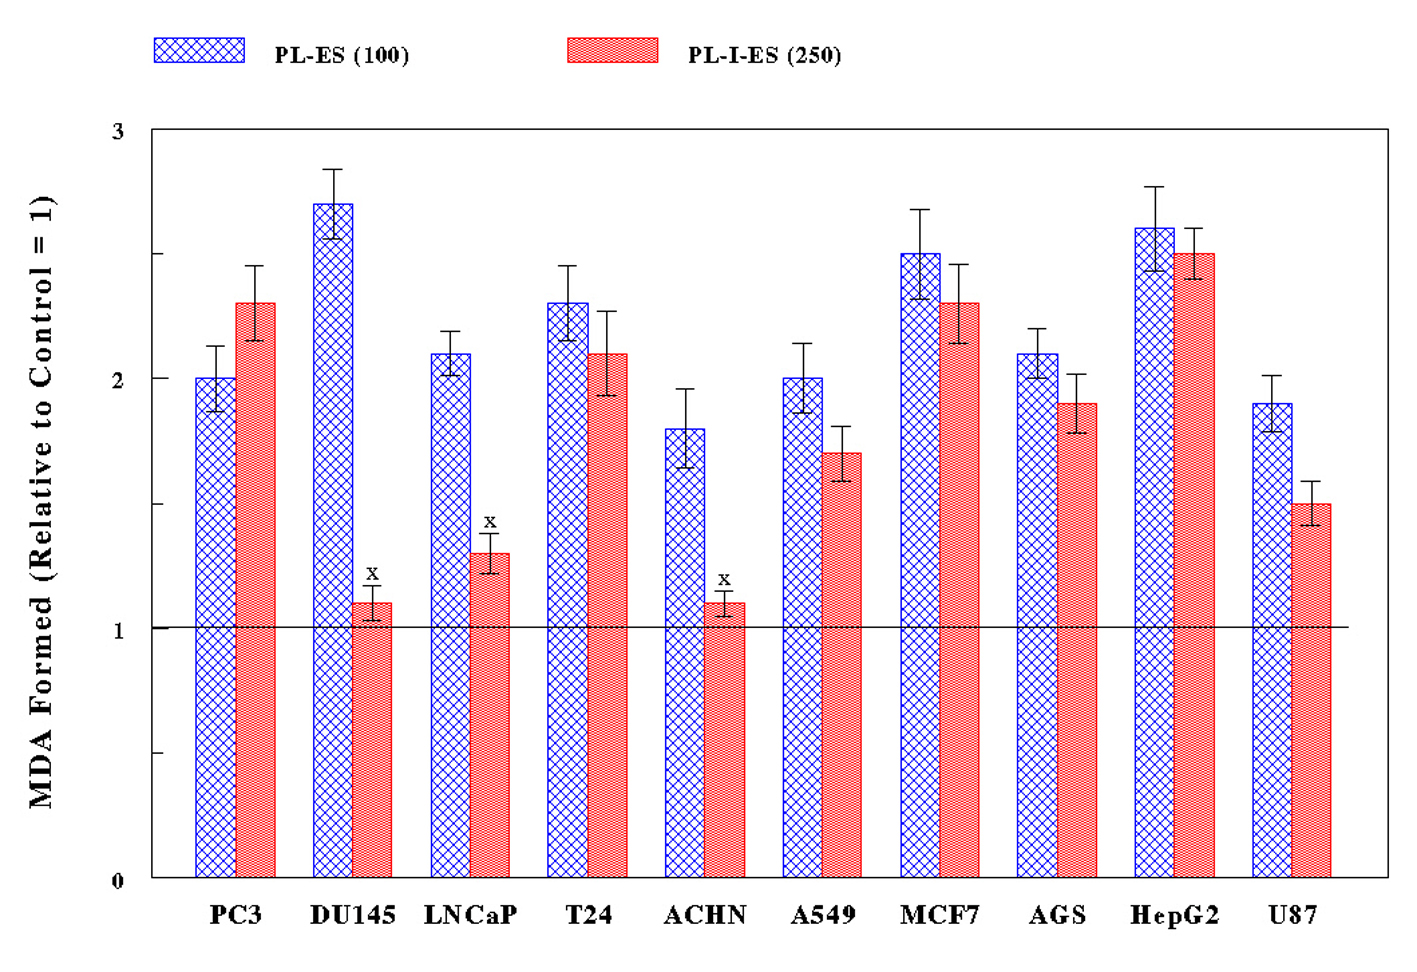
Figure 3. Exertion of oxidative stress. Ten cancer cells were treated with either PL-ES (100 µg/mL) or PL-I-ES (250 µg/mL) for 24 h and the severity of oxidative stress was assessed by LPO assay. The amounts of MDA formed indicate the degrees of oxidative stress, which are expressed arbitrarily relative to their respective controls (1.0 shown as a line). The amounts of MDF formed with PL-ES in all cancer cells and with PL-I-ES in seven cancer cells, except for three cancer cells (XP > 0.05), show statistically the significant differences (P < 0.05). All data represent mean ± SD from three separate experiments.