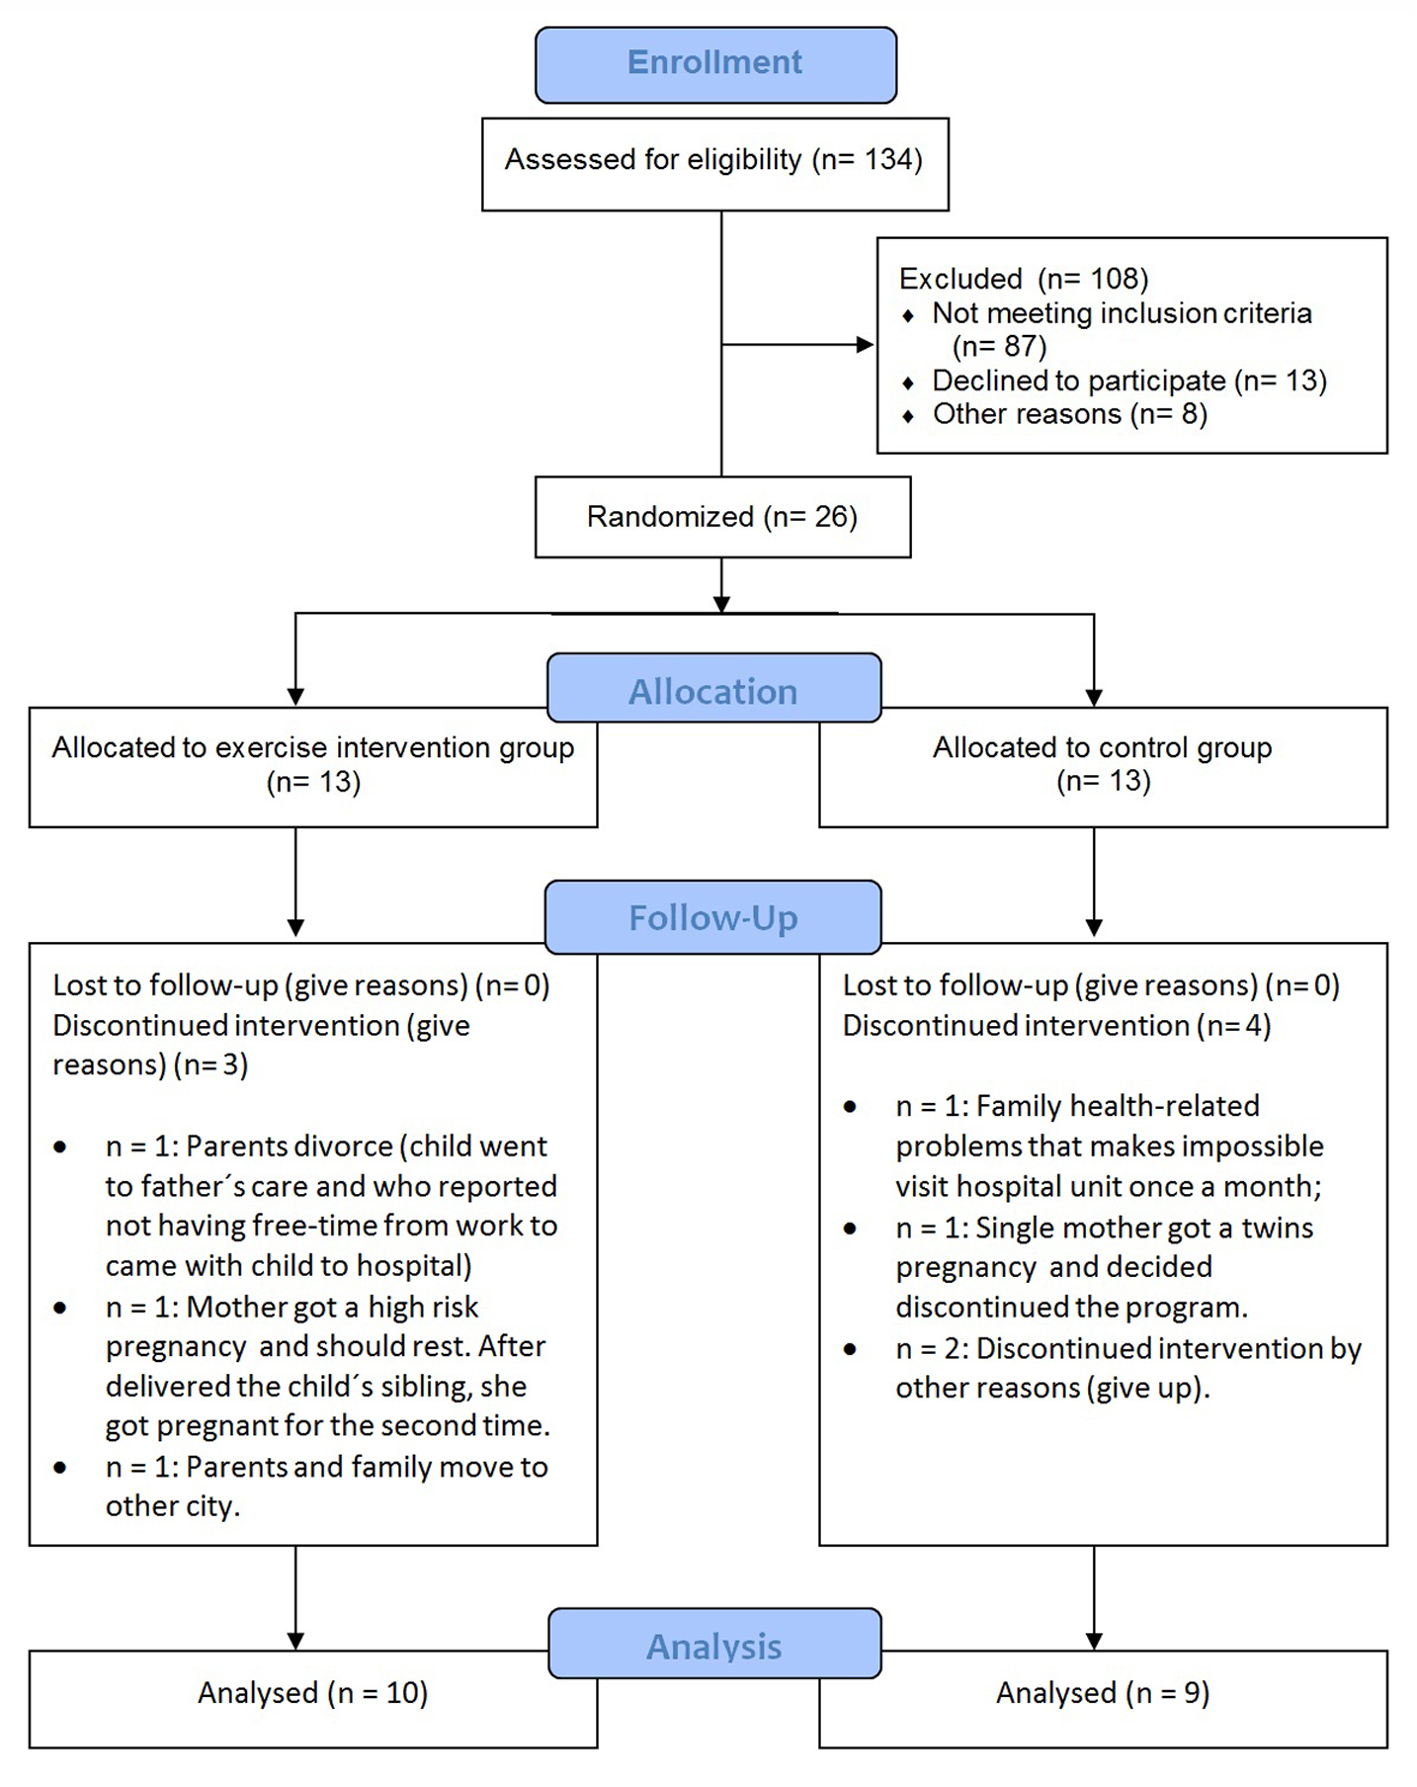
Figure 1. Participants flow diagram.
| Journal of Clinical Medicine Research, ISSN 1918-3003 print, 1918-3011 online, Open Access |
| Article copyright, the authors; Journal compilation copyright, J Clin Med Res and Elmer Press Inc |
| Journal website http://www.jocmr.org |
Original Article
Volume 7, Number 5, May 2015, pages 348-355
Effectiveness of Physical Exercise to Reduce Cardiovascular Risk Factors in Youths: A Randomized Clinical Trial
Figure
Tables
| Characteristic | T0 | P valuea | |
|---|---|---|---|
| Exercise group (n = 13) | Control group (n = 13) | ||
| BMI: body mass index; z-BMI: body mass index z-score; SD: standard deviation; WC: waist circumference; cm: centimeters; SBP: systolic blood pressure; DBP: diastolic blood pressure; mm Hg: millimeters of mercury; TC: total cholesterol; LDL-C: low-density lipoprotein; HDL-C: high-density lipoprotein; TG: triglycerides; mg/dL: milligram per deciliter; mmol/L: millimole per liter; hs-CRP: high-sensitivity C-reactive protein; min/day: minutes per day; IPAQ: international physical activity questionnaire; mm, millimeters. aDetermined using independent-samples t-test for continuous data. bDetermined using Pearson’s Chi-square test for categorized variables. | |||
| Age at first visit (years) | 12.3 ± 2.5 | 12.7 ± 3.1 | 0.735 |
| Gender | 1.00b | ||
| Male | 3 | 4 | |
| Female | 10 | 9 | |
| BMI father | 29.1 ± 8.4 | 29.6 ± 6.7 | 0.873 |
| BMI mother | 28.3 ± 5.3 | 29.1 ± 3.8 | 0.903 |
| Weight | 74.0 ± 19.1 | 69.8 ± 20.4 | 0.597 |
| Height | 153.9 ± 11.4 | 152.6 ± 9.9 | 0.772 |
| z-BMI (SD) | 2.8 ± 0.8 | 2.6 ± 1.3 | 0.669 |
| WC (cm) | 98.1 ± 14.8 | 93.4 ± 14.3 | 0.288 |
| Heart rate | 80.6 ± 12.2 | 79.9 ± 11.7 | 0.895 |
| Blood pressure | |||
| SBP (mm Hg) | 108.0 ± 11.6 | 117.0 ± 13.1 | 0.079 |
| DBP (mm Hg) | 67.3 ± 10.5 | 75.0 ± 11.5 | 0.089 |
| Normal levels | 9 (69.2) | 8 (61.5) | 1.00b |
| High levels | 4 (30.8) | 5 (38.5) | |
| TC (mg/dL) | 155.7 ± 20.3 | 146.7 ± 21.2 | 0.280 |
| LDL-C (mg/dL) | 95.3 ± 19.1 | 87.6 ± 20.2 | 0.342 |
| HDL-C (mg/dL) | 42.6 ± 7.8 | 37.5 ± 8.4 | 0.126 |
| TG (mg/dL) | 89.5 ± 28.7 | 105.5 ± 52.2 | 0.379 |
| Fasting glucose (mg/dL) | 90.3 ± 5.7 | 89.0 ± 6.1 | 0.581 |
| hs-CRP (mg/dL) | 0.42 ± 0.40 | 0.29 ± 0.21 | 0.317 |
| Screen time (min/day) | 369.0 ± 177.7 | 513.7 ± 185.3 | 0.115 |
| Sleep time (min/day) | 557.0 ± 96.7 | 475.0 ± 128.5 | 0.132 |
| IPAQ | |||
| Active | 7 (53.8) | 8 (61.5) | 1.00b |
| Sedentary | 6 (46.1) | 5 (38.4) | |
| Active leisure time (min/day) | 444.0 ± 435.6 | 424.6 ± 396.6 | 0.921 |
| Skin folds | |||
| Abdominal (mm) | 41.8 ± 15.5 | 38.1 ± 15.6 | 0.562 |
| Triceps (mm) | 33.0 ± 12.6 | 29.5 ± 12.3 | 0.483 |
| Subscapular (mm) | 31.1 ± 14.4 | 26.0 ± 11.5 | 0.359 |
| Characteristic | T14 | P valuea | |
|---|---|---|---|
| Exercise group (n = 10) | Control group (n = 9) | ||
| SD: standard deviation; WC: waist circumference; cm: centimeters; SBP: systolic blood pressure; DBP: diastolic blood pressure; mm Hg: millimeters of mercury; TC: total cholesterol; LDL-C: low-density lipoprotein; HDL-C: high-density lipoprotein; TG: triglycerides; mg/dL: milligram per deciliter; hs-CRP: high-sensitivity C-reactive protein; min/day: minutes per day; IPAQ: international physical activity questionnaire; mm: millimeters. aDetermined by use of the independent-samples t-test to continuous data. bDetermined using Pearson’s Chi-square test for categorized variables. | |||
| Weight | 81.5 ± 13.7 | 76.1 ± 14.0 | 0.476 |
| Height | 158.5 ± 9.0 | 157.3 ± 6.5 | 0.775 |
| z-BMI (SD) | 2.8 ± 0.57 | 2.5 ± 0.60 | 0.352 |
| WC (cm) | 90.5 ± 8.3 | 89.1 ± 7.3 | 0.740 |
| Heart rate | 87.1 ± 14.0 | 79.7 ± 10.6 | 0.267 |
| Blood pressure | |||
| SBP (mm Hg) | 114.6 ± 8.6 | 112.5 ± 13.7 | 0.745 |
| DBP (mm Hg) | 72.3 ± 8.9 | 67.0 ± 7.4 | 0.223 |
| TC (mg/dL) | 153.7 ± 20.8 | 157.3 ± 18.0 | 0.699 |
| LDL-C (mg/dL) | 87.4 ± 15.0 | 99.1 ± 22.5 | 0.244 |
| HDL-C (mg/dL) | 46.6 ± 8.9 | 39.6 ± 4.9 | 0.066 |
| TG (mg/dL) | 99.8 ± 47.7 | 91.0 ± 20.5 | 0.635 |
| Fasting glucose (mg/dL) | 88.5 ± 4.3 | 89.0 ± 7.2 | 0.858 |
| hs-CRP (mg/dL) | 0.42 ± 0.36 | 0.47 ± 0.28 | 0.741 |
| Screen time (min/day) | 347.5 ± 240.4 | 361.4 ± 151.0 | 0.901 |
| Sleep time (min/day) | 562.5 ± 89.8 | 547.1 ± 86.9 | 0.760 |
| IPAQ* | |||
| Active | 5 (83.3) | 4 (57.1) | 0.559b |
| Sedentary | 1 (16.7) | 3 (42.9) | |
| Active leisure time (min/day) | 424.1 ± 265.3 | 519.8 ± 540.1 | 0.702 |
| Skin folds | |||
| Abdominal | 50.3 ± 14.3 | 48.8 ± 7.0 | 0.798 |
| Triceps | 37.6 ± 9.0 | 34.2 ± 7.1 | 0.426 |
| Subscapular | 39.0 ± 14.3 | 35.4 ± 10.5 | 0.588 |