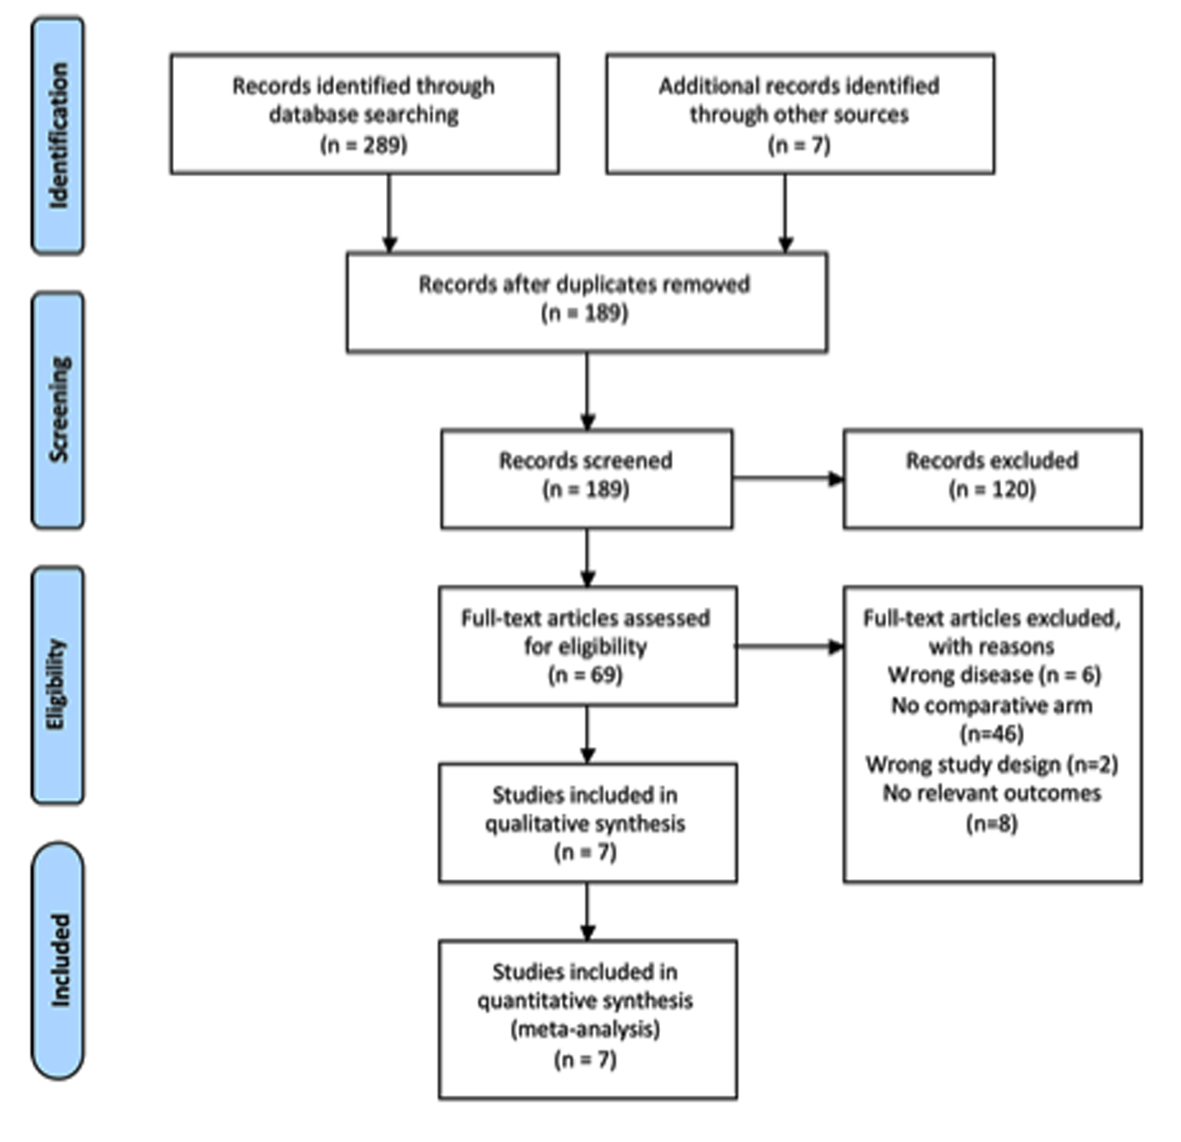
Figure 1. Systematic review PRISMA flow diagram.
| Journal of Clinical Medicine Research, ISSN 1918-3003 print, 1918-3011 online, Open Access |
| Article copyright, the authors; Journal compilation copyright, J Clin Med Res and Elmer Press Inc |
| Journal website http://www.jocmr.org |
Review
Volume 7, Number 5, May 2015, pages 289-296
A Systematic Review and Meta-Analysis of Open vs. Laparoscopic Resection of Gastric Gastrointestinal Stromal Tumors
Figures
Tables
| Concept 1 | Concept 2 | Concept 3 | Concept 4 | Results | |||
|---|---|---|---|---|---|---|---|
| Limit to English language. | |||||||
| laparoscop* or exp laparoscopy or telesurg* or “tele surg*” or minimal* adj3 (invasiv* or access*) or celiosc* | AND | (usual or wedge or traditional or standard* or open or invasive or normal or routine) adj3 (resect* or surger* or surgi*) | AND | GIST or exp gastrointestinal stromal tumors/or (gastrointestinal stromal adj2 (neoplasm* or tumo*)).mp. | AND | gastri* or stomach | 81 |
| Authors | Year | Journal name | Article name | Design | Outcomes | Follow-up period (months) | |
|---|---|---|---|---|---|---|---|
| L | O | ||||||
| RCS: retrospective cohort study; CCS: case-control study; BMI: body mass index; LOS: length of stay; OR time: operating room time; EBL: estimated blood loss; Med: median; N/A: not available; L: laparoscopic group; O: open group. | |||||||
| Catena et al | 2008 [1] | Journal of Gastrointestinal Surgery | Laparoscopic treatment of gastric GIST: report of 21 cases and literature’s review | RCS | LOS OR time Adverse events Conversion rate Overall survival EBL Recurrence rate | Mean: 35 | Mean: 91 |
| Nishimura et al | 2007 [3] | Surgical Endoscopy | Surgical strategy for gastric gastrointestinal stromal tumors: laparoscopic vs. open resection | RCS | OR time Conversion rate EBL Recurrence rate | Median: 19 | Median: 31 |
| Karakousis et al | 2011 [10] | Annals of Surgical Oncology | Laparoscopic versus open gastric resections for primary gastrointestinal stromal tumors (GISTs): a size-matched comparison | CCS | LOS OR time Adverse events Overall survival EBL Recurrence rate | Median: 28 | Median: 43 |
| Matthews et al | 2002 [11] | Surgical Endoscopy | Laparoscopic vs. open resection of gastric stromal tumors | RCS | LOS OR time Adverse events EBL Recurrence rate | Mean: 20 | Mean: 18 |
| Pitsinis et al | 2007 [12] | Hepato-Gastroenterology | Single center experience of laparoscopic vs. open resection for gastrointestinal stromal tumors of the stomach | RCS | LOS OR time Adverse events Recurrence rate | Median: 9 | Median: 9 |
| Silberhumer et al | 2009 [13] | Journal of Gastrointestinal Surgery | Surgery for gastrointestinal stromal tumors of the stomach | RCS | LOS Adverse events Conversion rate Recurrence rate | Mean: 30 | Mean: 41 |
| Wu et al | 2010 [14] | Journal of Laparoscopic and Advanced Surgical Techniques | Gasless laparoscopy-assisted versus open resection for gastrointestinal stromal tumors of the upper stomach: preliminary results | RCS | LOS OR time Adverse events Pain score Conversion rate Overall survival EBL | N/A | N/A |
| Authors, year | Number of patients | Age | BMI | Tumor size | Procedures performed | |||||
|---|---|---|---|---|---|---|---|---|---|---|
| L | O | L | O | L | O | L | O | L | O | |
| Values expressed as mean unless otherwise indicated. t: median value. L: laparoscopic group; O: open group; N/A: not available; W: wedge resection; DG: distal gastrectomy; PG: proximal gastrectomy; TG: total gastrectomy. | ||||||||||
| Catena et al, 2008 [1] | 21 | 25 | 50.1 | 54.6 | N/A | N/A | 4.5 | 6.2 | 86% W; 14% DG | 50% W; 33% DG; 17% PG |
| Nishimura et al, 2007 [3] | 39 | 28 | 62t | 63t | N/A | N/A | 3.8t | 4.2t | 100% W | 68% W; 4% DG; 18% PG; 11% TG |
| Karakousis et al, 2011 [10] | 40 | 40 | 67t | 70t | N/A | N/A | 3.6t | 4.3t | 100% W | 95% W; 5% DG |
| Matthews et al, 2002 [11] | 21 | 12 | 53.9 | 50.5 | N/A | N/A | 4.5 | 4.9 | 86% W; 14% DG | 50% W; 33% DG; 17% PG |
| Pitsinis et al, 2007 [12] | 6 | 7 | 70t | 68t | N/A | N/A | 5t | 11.5t | N/A | N/A |
| Silberhumer et al, 2009 [13] | 22 | 41 | 61.3 | 62.5 | N/A | N/A | 3.5 | 5.8 | 100% W | 78% W; 12% DG; 10% TG |
| Wu et al, 2010[14] | 15 | 13 | 61.6 | 60.7 | 23.4 | 22.7 | 2.6 | 2.5 | 100% W | 100% W |
| Study ID | Catena et al, 2008 [1] | Nishimura et al, 2007 [3] | Karakousis et al, 2011 [10] | Matthews et al, 2002 [11] | Pitisinis et al, 2007 [12] | Silberhumer et al, 2009 [13] | Wu et al, 2012 [14] |
|---|---|---|---|---|---|---|---|
| Study design | Retrospective cohort | Retrospective cohort | Case-control study | Retrospective cohort | Retrospective cohort | Retrospective cohort | Retrospective cohort |
| Selection | **** | **** | **** | **** | **** | **** | **** |
| Comparability | * | ||||||
| Outcome/exposure | *** | *** | *** | *** | *** | *** | *** |