Journal of Clinical Medicine Research, ISSN 1918-3003 print, 1918-3011 online, Open Access
Article copyright, the authors; Journal compilation copyright, J Clin Med Res and Elmer Press Inc
Journal website http://www.jocmr.org

Original Article

Volume 4, Number 6, December 2012, pages 363-370


fMRI Under Sedation: What Is the Best Choice in Children

Figure

Figure 1.
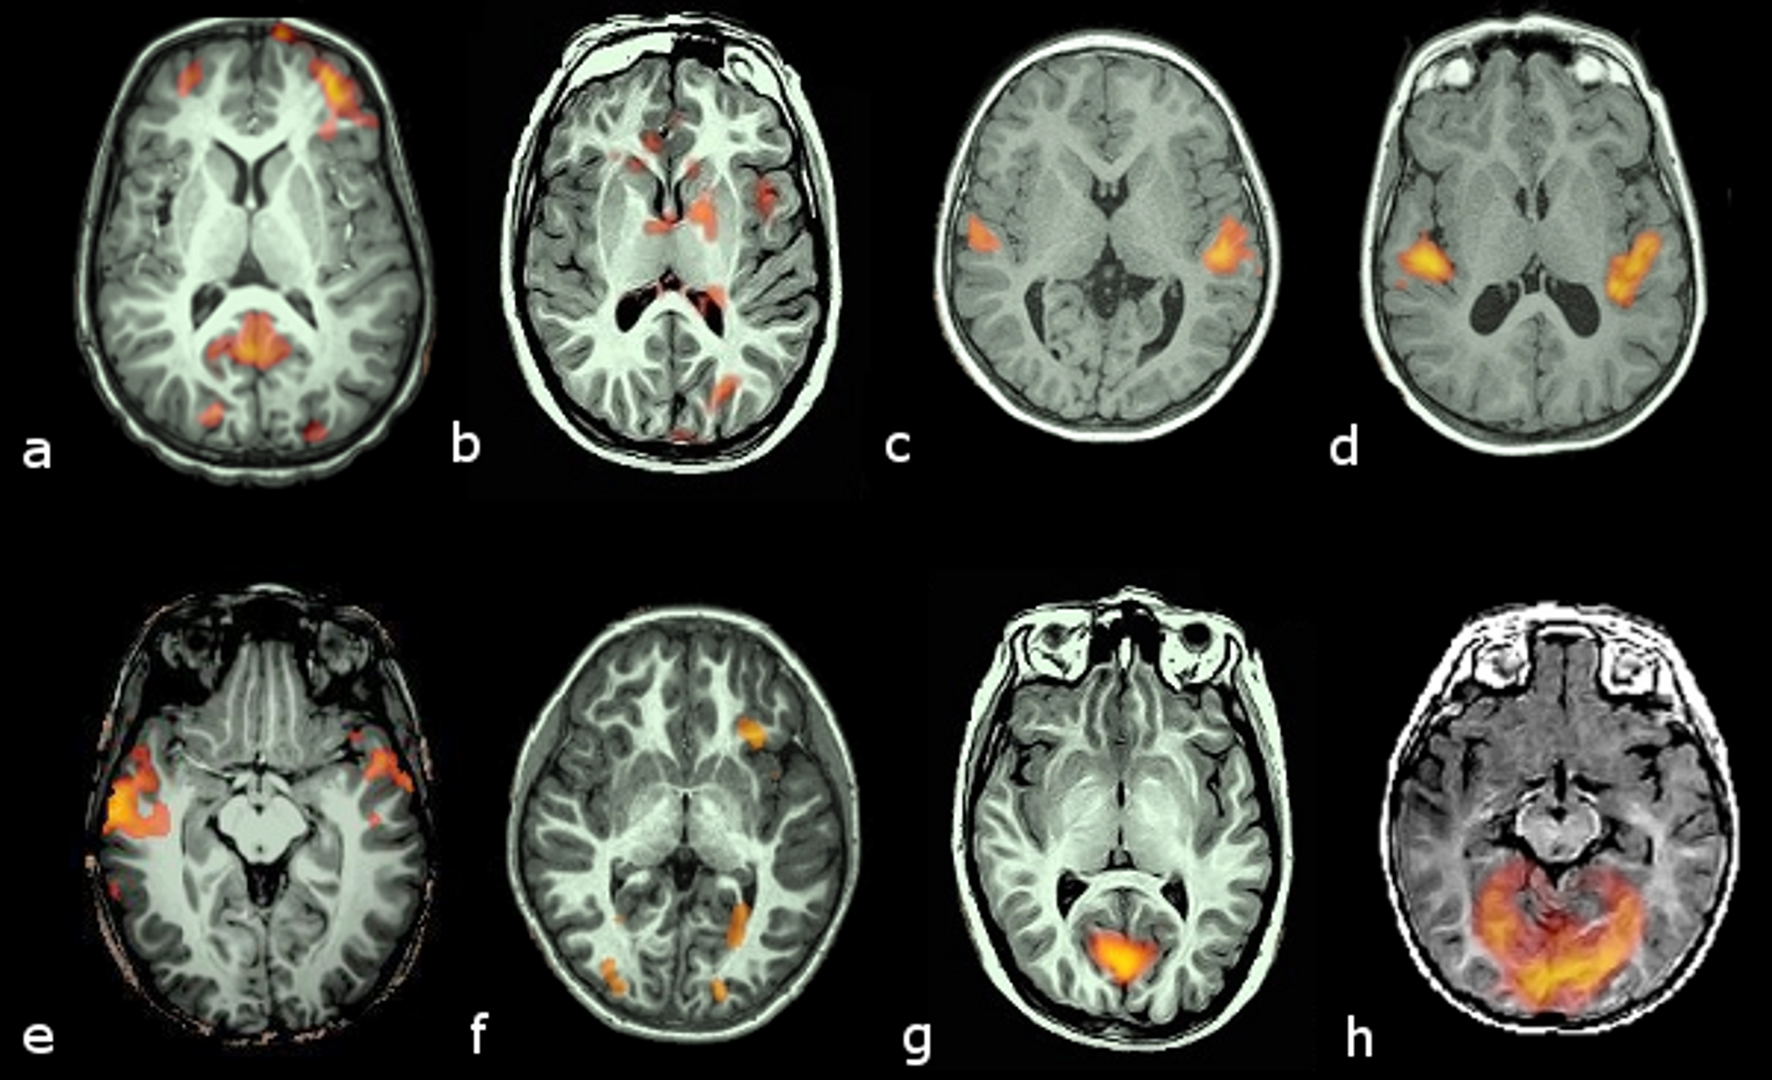
Figure 1. Examples of activation ranking. Transversal slices in radiological convention (left hemisphere on the right side) of 8 cases with different brain activation types. Activation maps are color coded from bright yellow (highest) to red (lowest) intensities. Upper row (a to d) corresponds to activations obtained with the auditory stimulus. Lower row (e to h) corresponds to activations obtained with the visual stimulus: Rank 1, no activation in canonical areas (planum temporale for the auditory or medial occipital lobe for the visual), but some activation outside them (a, e); Rank 2, weak and scattered activation in the canonical areas, with some activation in other areas (b, f); Rank 3, small but otherwise well defined areas of activation of canonical areas (c, g); Rank 4, well defined and large activation of target areas (d, h).

Tables

Table 1. Patient Demographics According to Sedation Medication Administered
 
ItemPenPen+ProDexDex-ProSevTotal
*: mg/kg; **: μg/kg/m; ***: μg/kg/hr. Pen was administered by bolus; Pro and Dex were administered by infusion.
N17131924189100
Male11891413459
Female6510105541
Age mean5.35.76.166.07.16.96.23
Age range1 - 139m - 141 - 148m - 141 - 171 - 191 - 19
Mean dose4.64 (*)3.2697.9 (**)1.8 (***)0.7/900.5 MAC
Dose range3.0 - 8.02.5 - 5.050 - 1000.8 (***)0.5 - 0.9/50 - 2000.3 - 0.75 MAC


Table 2. Failure Rates (No Activation Obtained in Canonical (Auditory or Visual) Areas
 
MedicationAuditory TaskVisual Task
Pen18% (3/17)25% (4/16)
Pen +38% (5/13)15% (2/13)
Pro21% (4/19)39% (7/18)
Dex25% (6/24)46% (11/24)
Dex-Pro28% (5/18)11% (2/18)
Sev44% (4/9)44% (4/9)
Average0.290.315


Table 3. Activation Intensity by Medication (Including Ranks 0 and 1)
 
NumberAuditory meanAuditory SDVisual meanVisual SD
Ranking means includes all ranks (0 to 4). (*) = Auditory and visual, respectively.
Pen17/16(*)3.01.372.811.52
Pen+132.311.73.001.22
Pro19/182.371.382.281.78
Dex242.541.642.041.9
Dex-Pro182.831.543.171.25
Sev91.781.391.561.51
ANOVA Ho =(Auditory) P = 0.42
(Visual) P = 0.077


Table 4. Activation Intensity of Cases With Activation in Canonical Areas (Rank 2 to 4)
 
Auditory - meanAuditory - SDVisual - meanVisual - SD
The null hypothesis was not rejected for either group (Auditory: ANOVA P = 0.1; F = 1.95); (Visual: P = 0.17, F = 1.61).
Pen3.50.853.580.67
Pen+3.50.763.450.52
Pro2.930.883.550.82
Dex3.390.783.690.63
Dex-Pro3.690.633.560.51
Sev2.80.842.80.45
ANOVA(A) P = 0.1
Ho =(V) P = 0.12


Table 5. Duration of Sedation
 
MedicationTime - mean (minutes)Time - SD
Pen98.831.10
Pen+144.2717.85
Pro126.5837.04
Dex148.8328.87
Dex-Pro151.4413.56
Sev140.5622.84
ANOVAP = 0.0005
F = 7.85


Table 6. Recovery Time
 
MedicationTime - mean (minutes)Time - SD
Pen47.035.67
Pen+27.9314.9
Pro18.4714.35
Dex28.9215.15
Dex-Pro28.1115.95
Sev17.334.39
ANOVAP = 0.0005
F = 4.47