


| Journal of Clinical Medicine Research, ISSN 1918-3003 print, 1918-3011 online, Open Access |
| Article copyright, the authors; Journal compilation copyright, J Clin Med Res and Elmer Press Inc |
| Journal website http://www.jocmr.org |
Original Article
Volume 10, Number 3, March 2018, pages 182-188
A Randomized Controlled Trial of a Mini Low-Carbohydrate Diet and an Energy-Controlled Diet Among Japanese Patients With Type 2 Diabetes
Masayo Kimuraa, b, Yoshinobu Kondoa, Kazutaka Aokia, c, Jun Shirakawaa, Hiroshi Kamiyamaa, b, Kazunari Kamikoa, b, Shigeru Nakajimab, Yasuo Terauchia, d
aDepartment of Endocrinology and Metabolism, Graduate School of Medicine, Yokohama City University, Yokohama 236-0004, Japan
bNakajima Naika Clinic, Yokosuka 238-0011, Japan
cInternal Medicine, Kanagawa Dental University, Yokosuka, Japan
dCorresponding Author: Yasuo Terauchi, Department of Endocrinology and Metabolism, Graduate School of Medicine, Yokohama City University, Fukuura 3-9, Kanazawa-ku, Yokohama 236-0004, Japan
Manuscript submitted November 24, 2017, accepted December 22, 2017
Short title: Effects of a Low-Carbohydrate Diet
doi: https://doi.org/10.14740/jocmr3281w
| Abstract | ▴Top |
Background: Low-carbohydrate diets have been shown to effectively improve the metabolic status of patients with type 2 diabetes mellitus. However, patients may find it challenging to maintain a strict low-carbohydrate diet. The objective of this study was to determine if a one-meal, low-carbohydrate diet is as effective in improving metabolic status as a conventional, energy-restricted diet among patients with type 2 diabetes mellitus.
Methods: In this 12-week randomized controlled study, the primary endpoint was differences in the changes of plasma glycosylated hemoglobin (HbA1c) levels between the two experimental groups. Since the two groups had differences in body weight, body mass index, and waist circumference, propensity score matching was used to assess HbA1c outcomes via cohort pairs according to age, sex, body weight, HbA1c level, and waist circumference.
Results: There were no differences in the changes in HbA1c between the two groups (P = 0.95). In addition, there were no differences in the changes in glycated albumin, 1,5-anhydroglucitol, lipid profile, body weight, waist circumference, and fat mass between the two groups. The mini low-carbohydrate diet group had an increased protein intake (P = 0.0085), as compared with the control group. However, neither group showed changes in their Diabetes Treatment Satisfaction Questionnaire score.
Conclusion: Either diet would be effective for improving the metabolic status of this study population.
Keywords: Low-carbohydrate diet; Energy-controlled diet; Hemoglobin A1c; Body weight; Diabetes Treatment Satisfaction Questionnaire
| Introduction | ▴Top |
Therapeutic dietary modification is fundamental in the treatment of patients with type 2 diabetes mellitus [1]. Previous studies have suggested that low-carbohydrate diets can effectively reduce body weight and improve plasma glucose levels and lipid profiles in patients with diabetes [2-9]. However, patients may have difficulty maintaining a strict dietary carbohydrate restriction for a long period. In addition, carbohydrate-rich foods are easily obtained and prepared, adding to the difficulty of restricting carbohydrates at every meal. Therefore, restricting carbohydrate intake for only one meal per day may be easier for patients to manage. The objective of this study was to determine if a one-meal, mini low-carbohydrate diet (mini-LCD) is as effective in improving metabolic status as a conventional, energy-restricted diet among patients with type 2 diabetes mellitus.
| Materials and Methods | ▴Top |
From January to September 2014, a randomized controlled trial was conducted at a single general clinic located in the Kanagawa region of Japan. This study protocol was approved by the Institutional Review Board of Yokohama City University. The trial was registered as the EMILY study in UMIN-CTR 000012894. All study participants provided written informed consent. The study participants comprised patients with type 2 diabetes mellitus who were randomly assigned to study groups via the minimization method, using a table of random numbers.
Eligibility criteria
Patients were included in the study if they were at least 20 years old but younger than 85 years, diagnosed with type 2 diabetes mellitus, had a glycosylated hemoglobin (HbA1c) level < 8.6%, and were undergoing dietary therapy with or without additional oral glucose-lowering medications. Patients were excluded if they had comorbid conditions, including macroalbuminuria (≥ 300 mg/g creatinine), chronic kidney disease with an estimated glomerular filtration rate of < 60 mL/min/1.73 m2, malignant or acute diseases, severe liver disease, decreased pancreatic function as a result of chronic pancreatitis, hyperthyroidism, and adrenal insufficiency, and if they had undergone steroid treatment, were incapable of self-managing their diabetes because of dementia, or were deemed unsuitable for enrollment in this study by an attending physician.
Dietary interventions and nutritional guidance
The same level of daily caloric intake was established for both dietary groups. Patients received nutritional counseling provided by certified dietitians at the following three time-points: pre-intervention, at week 4, and week 8 of the study period. Each session lasted approximately 15 min.
For both groups, a certified dietitian used a food exchange list to provide guidance to the patients regarding the restriction of daily energy intake to 25 - 30 kcal/kg of their ideal body weight after determining the patients’ ideal body weight (height (m)2 × 22). Patients were counseled to avoid snacks and evening meals. At each session, patients were given feedback on the calculated calorie and macronutrient intake results, and advised to set their next goals.
Patients were asked to submit their food records from three self-selected days between each guidance session. Patients were asked to select what they considered “average” days, as opposed to “special” days. The energy and macronutrient intakes were calculated using dietary assessment software (Healthy Maker Pro 501; Mushroom Soft Institute, Nagano, Japan) and a food consumption table.
In the mini-LCD group, patients were instructed to restrict their carbohydrate intake at dinner, but were permitted to consume the same amount of energy as they normally did for breakfast and lunch. The targeted macronutrient ratios (expressed as percentages of daily energy intake) were as follows: 1) breakfast and lunch: carbohydrates, 55-60%; fats, 20-25%; proteins, 15-20%; 2) dinner: carbohydrates, 15%; fats, 45%; proteins, 40%; 3) total diet: carbohydrates, 40%; fats, 30-35%; proteins, 25-30%.
The same calorie restriction as the mini-LCD group was imposed on the energy controlled diet (ECD) group, but without carbohydrate restriction at dinner. In the ECD group, the targeted macronutrient ratios were as follows: all meals: carbohydrates, 55-60% of the daily energy intake; fats, 20-25% of the daily energy intake; and proteins, 15-20% of the daily energy intake.
Diabetes Treatment Satisfaction Questionnaire (DTSQ)
The DTSQ [10] is designed to assess a patient’s overall level of satisfaction with his or her diabetes treatment, as well as the frequency of hyperglycemic and hypoglycemic episodes. The questionnaire contained eight questions, and responses were graded on a scale of 0 - 6, with higher scores indicating greater satisfaction, except for questions 2 and 3. Accordingly, the total scores were tallied for all the questions, except for questions 2 and 3. Questions 2 and 3 were evaluated separately and pertained to the frequency of hyperglycemic and hypoglycemic episodes associated with the most recent diabetes care. For these questions, lower scores indicated better satisfaction.
Study endpoints
The primary endpoint was the degree of change in HbA1c between the two groups during the 12-week study period. The secondary endpoints were changes in glycated albumin and 1,5-anhydroglucitol (1,5-AG), body weight, waist circumference, body composition, and basal energy expenditure. Blood samples were collected at random times (before meals or after meals) at every visit (weeks 0, 4, 8, and 12). Glycated albumin, 1,5-AG, and ketone levels were measured at weeks 0 and 12. Body fat, muscle, and basal energy expenditure were measured using an Inbody 770 body composition analyzer (Inbody, Seoul, Korea) at weeks 0 and 12. Other factors, including HbA1c, lipid profile, waist circumference, and body weight were measured at each visit (weeks 0, 4, 8, and 12) (Fig. 1).
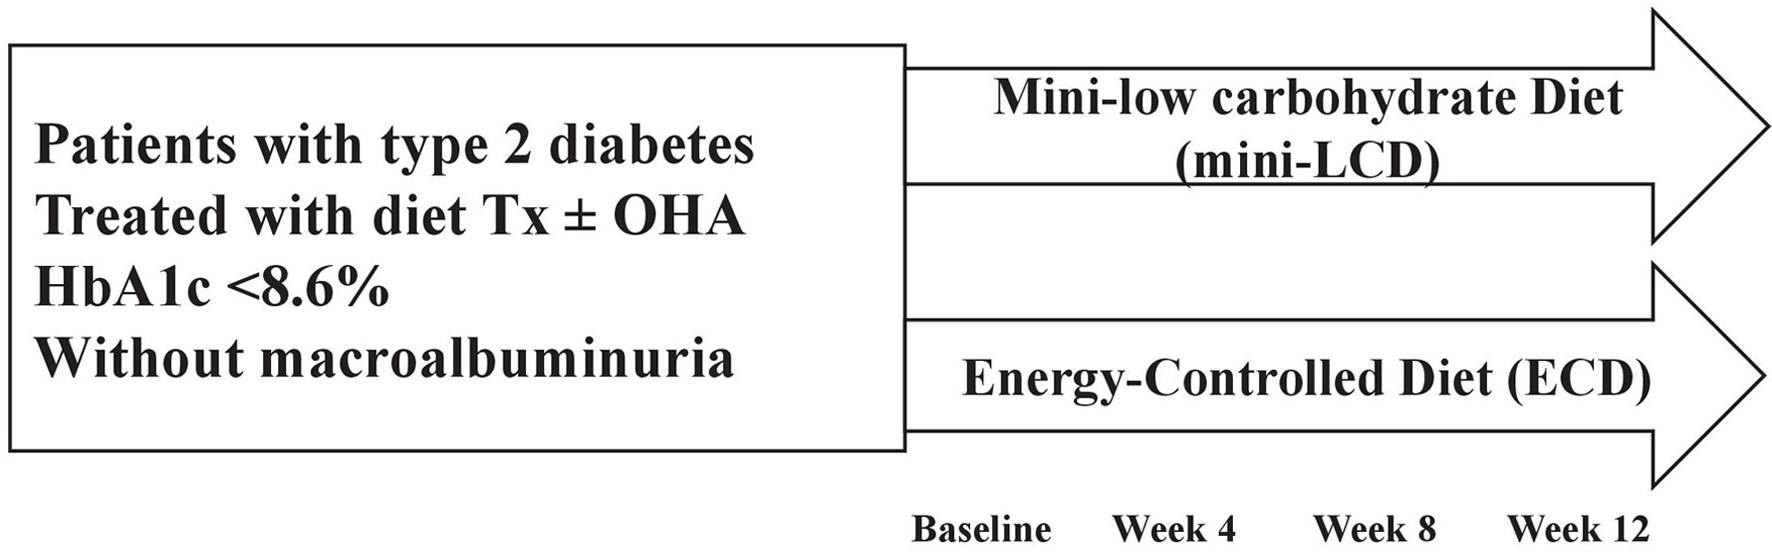 Click for large image | Figure 1. Study design. Mini-LCD: mini low-carbohydrate diet; ECD: energy-controlled diet; Tx: therapy; OHA: oral hypoglycemic agent. |
Laboratory tests and equipment
Plasma glucose samples were sent to, and assessed by Hokenkagaku Institute Inc. (Yokohama, Japan). Blood glucose was measured using a glutest-mint glucose analyzer (Sanwa-kagaku, Japan). HbA1c was measured using an ADAMS HA-8180 analyzer (ARKRAY Inc., Singapore). Urine samples were measured using an AUTION ELEVEN AE-4020 analyzer (ARKRAY Inc., Singapore). Body mass index (BMI) was calculated as body weight (kg)/height (m)2.
Statistical analyses
Values are expressed as mean ± standard error (SE) for baseline characteristics, or median (interquartile range) for the results of the statistical analyses and absolute values for the remaining parameters. The effects of dietary interventions were evaluated using either a paired t-test, or repeated-measures analysis of variance (ANOVA). Continuous variables with asymmetric distributions are expressed as medians and interquartile ranges and were analyzed using the Wilcoxon rank-sum test. Categorical variables are expressed as frequencies and percentages and were analyzed using Pearson’s Chi-squared test. Multiple imputation [11, 12] was used where there were missing baseline values, adjusted for age, sex, body weight, HbA1c, basal energy expenditure, waist circumference, and height. The remaining variables were included as part of the imputation process. The criterion for therapy completion in the study was defined as the availability of follow-up data from the baseline up to week 12 of the study. Incomplete follow-up data (weeks 4, 8 and 12) were imputed using the “last observation carried forward” method.
After randomization, there were significant differences in body weight, BMI, and waist circumference between the groups (Table 1). Propensity score matching was used to adjust the baseline points between the two groups. Propensity score-matched cohorts were used to assess HbA1c outcomes by pairing age, sex, body weight, HbA1c, and waist circumference. The propensity score was determined using a multiple logistic regression model with a forced entry method. Twenty-four matching pairs from the mini-LCD and ECD groups were extracted using the propensity score results.
 Click to view | Table 1. Baseline Characteristics Before and After Propensity Score Matching |
One-to-one nearest-neighbor matching with replacement based on the propensity score was then performed. To test and maximize this approach, the matching process was repeated without the replacement option, using calipers, and logit from the propensity score. Calipers were set to the width equal to 0.25 the standard deviation of the logit score. Once the propensity score-matched cohorts were established, baseline demographic and clinical characteristics were tabulated in the format described for the whole population. The cohort results before and after matching are shown in Table 1. All analyses were conducted using JMP 12 software (SAS Institute Inc., Cary, NC, USA).
| Results | ▴Top |
A total of 48 patients participated in this study (Fig. 2); of these, 25 and 23 were allocated to the mini-LCD group and ECD group, respectively. One patient in the mini-LCD group failed to comply with the diet throughout the study period, and one patient in the ECD group stopped visiting the outpatient clinic. There were no changes in medications for the patients during the study period. Except for baseline weight, BMI and waist circumference, the two groups exhibited similar demographic characteristics (Table 1). Before propensity score matching, there was no difference in the primary endpoint, HbA1c, from week to week between the groups (week 4, P = 0.96; week 8, P = 0.43; week 12, P = 0.71). No differences were observed in HbA1c (P = 0.60), waist circumference (P = 0.35), fat mass (P = 0.50), energy intake (P = 0.42), fat intake (P = 0.34), ketone levels (P = 0.82), DTSQ question 2 (P = 0.41), or DTSQ question 3 (P = 0.21) at week 12, compared to the baseline. However, since the two groups showed differences in body weight, BMI and waist circumference at the baseline, we could not compare changes between both groups. Propensity score matching was then used to assess HbA1c outcomes via cohort pairs according to age, sex, body weight, HbA1c level, and waist circumference.
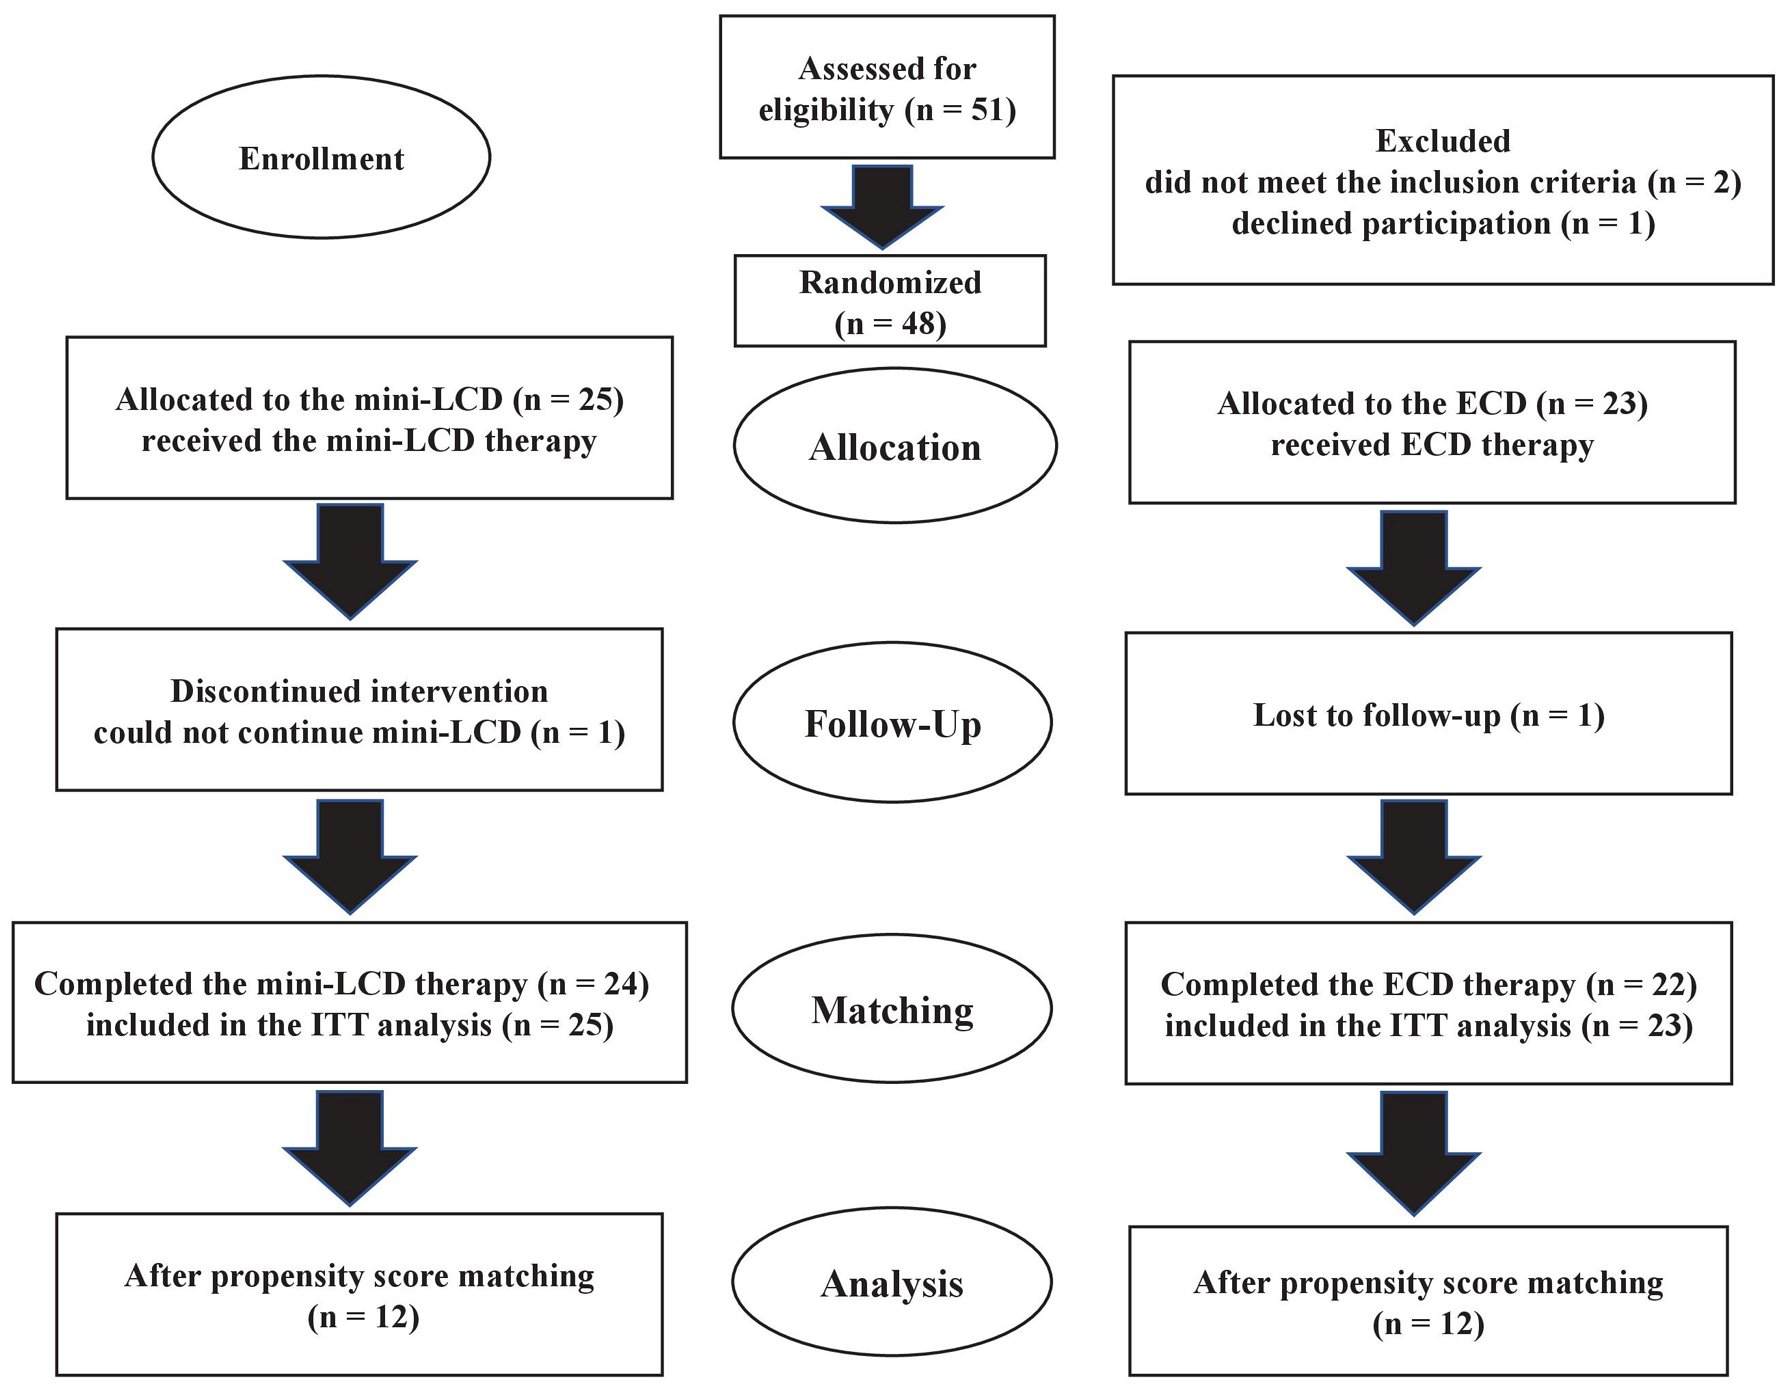 Click for large image | Figure 2. The flow of patient selection in this study. Mini-LCD: mini low-carbohydrate diet; ECD: energy-controlled diet; ITT: intention to treat. |
After propensity score matching, there were no observed differences between the two groups regarding HbA1c (P = 0.88), glycated albumin (P = 0.18), 1,5-AG (P = 0.54), waist circumference (P = 0.99), body weight (P = 0.73), fat mass (P = 0.47), HDL cholesterol (P = 0.72), energy intake (P = 0.56), carbohydrate intake (P = 0.26), fat intake (P = 0.86), total DTSQ (P = 0.49), DTSQ question 2 (P = 0.76), or DTSQ question 3 (P = 0.59). However, there was a difference in LDL cholesterol levels between the two groups (P = 0.018).
Table 2 shows the results throughout the intervention before and after propensity score matching. Before propensity score matching, there was no difference in the primary endpoint, HbA1c, from week to week between the groups (week 4, P = 0.96; week 8, P = 0.43; week 12, P = 0.71). Propensity score matching was then used to assess HbA1c outcomes via cohort pairs according to age, sex, body weight, HbA1c level, and waist circumference.
Click to view | Table 2. Treatment Time Course Before and After Propensity Score Matching |
After propensity score matching, there was no difference in the primary endpoint, HbA1c, from week to week between the groups (week 4, P = 0.56; week 8, P = 0.99; week 12, P = 0.49). Patients in the ECD group showed a significant difference in HbA1c at week 12, as compared with the baseline (P = 0.04); however, no significant difference was seen in patients in the mini-LCD group (P = 0.11) (Fig. 3). No difference was seen in the body weight of patients in either group at week 12, as compared with the baseline (mini-LCD, P = 0.14; ECD, P = 0.26) (Fig. 4). In addition, no differences were seen in HbA1c (P = 0.95), body weight (P = 0.99), waist circumference (P = 0.60), fat mass (P = 0.44), energy intake (P = 0.29), fat intake (P = 0.27), ketones (P = 0.60), DTSQ total score (P = 0.53), DTSQ question 2 (P = 0.34), or DTSQ question 3 (P = 0.36) at week 12, as compared with the baseline. However, a significant difference was observed in protein intake during week 12: baseline (P = 0.89), week 4 (P = 0.43), week 8 (P = 0.79), and week 12 (P = 0.045). There was a significant difference in protein intake between the two groups from the baseline and week 12 (P = 0.0085). Table 2 also shows the percentage of nutrient energy per daily energy intake after randomization.
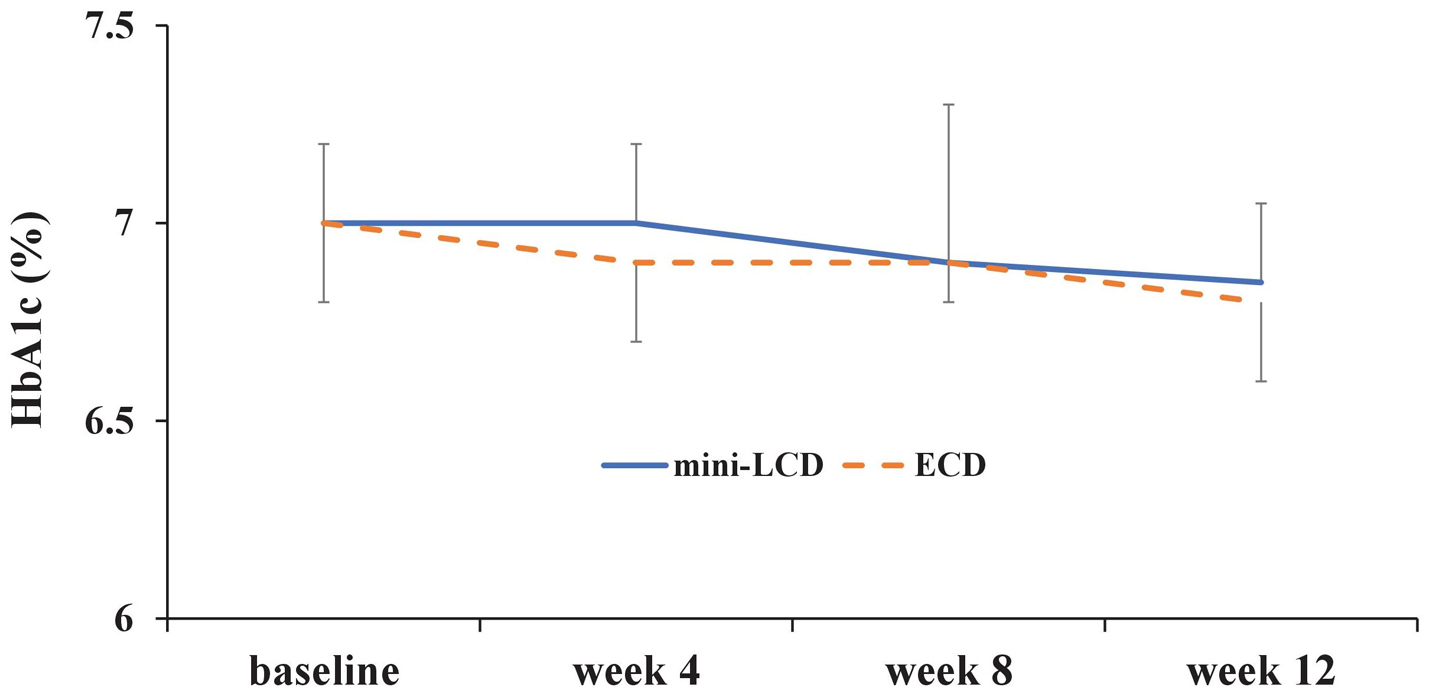 Click for large image | Figure 3. Change in HbA1c (%). Mini-LCD: mini low-carbohydrate diet; ECD: energy-controlled diet; HbA1c: glycosylated hemoglobin. |
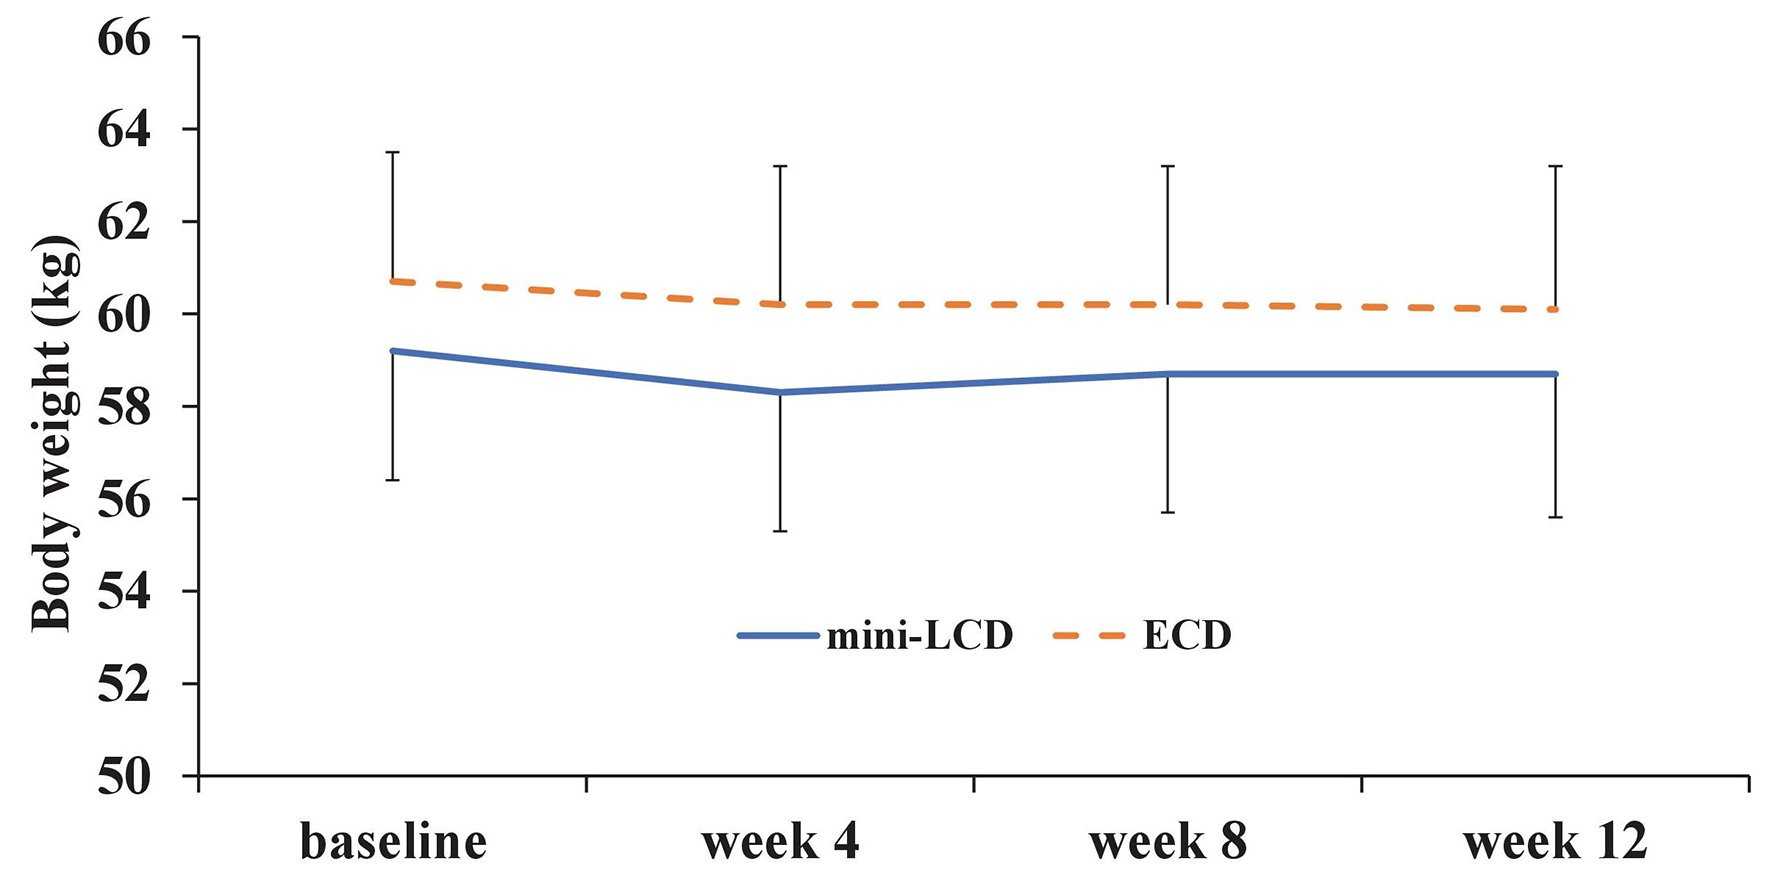 Click for large image | Figure 4. Change in body weight (kg). Mini-LCD: mini low-carbohydrate diet; ECD: energy-controlled diet. |
| Discussion | ▴Top |
In the present study, since there was a difference between groups at the baseline in terms of body weight, BMI, and waist circumference after randomization, propensity score matching was used to reduce this difference as much as possible. However, the trend in HbA1c through dietary intervention did not change after propensity score matching.
Although a difference in HbA1c was observed in patients in the ECD group from weeks 0 to 12 after propensity score matching, the change between the two groups was not significant. Thus, both diets could be used as alternative therapies in daily medical care for patients with type 2 diabetes.
Similarly, body weight and waist circumference were unchanged at week 12 for both groups, and carbohydrate intake in the mini-LCD group was also unchanged at week 12. However, an increase in protein intake was observed in the mini-LCD group from the baseline to week 12 (P = 0.045). On further comparing the protein intake from baseline and week 12 between the two groups, we observed that the mini-LCD group tended to have a higher protein intake than the ECD group (P = 0.0085). This trend is believed to be as a result of the nutritional counseling provided by the dieticians who recommended eating a side dish that did not contain carbohydrates. Therefore, nutritional counseling that recommends a mini-LCD may support glycemic control by encouraging patients to eat side dishes containing protein. Furthermore, as instructed, patients in the mini-LCD group kept their calorie intake stable. Although previous reports have demonstrated that low carbohydrate diets are associated with weight loss in obese patients [4, 13, 14], the present study found that patients taking the mini-LCD diet maintained a stable body weight. According to the results of the DTSQ, both therapies did not change the patients’ quality of life.
Study limitations
There were several limitations in the present study. First, there were significant differences in body weight, BMI, and waist circumference between the two groups after randomization (Table 1). However, propensity score matching was used to adjust the baseline points between the groups before analyzing patient data. Second, there were data deficits in terms of the calorie and macronutrient outcome, as well as DTSQ outcome, and we had to perform multiple imputations. Third, blood samples were collected at random times; therefore, we are unable to evaluate blood glucose levels. Fourth, carbohydrate intake did not change from the baseline to week 12 in either group.
Acknowledgments
The authors thank the following nurses and dietitians: M. Toyoda, I. Mutou, M. Funaoka, Y. Hamamoto, and M. Suzuki.
Conflict of Interest
None of the authors have any potential conflict of interest associated with this research.
| References | ▴Top |
- American Diabetes Association. Standards of medical care in diabetes - 2014. Diabetes Care. 2014;37(Suppl 1):S14-80.
doi pubmed - Dyson PA, Beatty S, Matthews DR. A low-carbohydrate diet is more effective in reducing body weight than healthy eating in both diabetic and non-diabetic subjects. Diabet Med. 2007;24(12):1430-1435.
doi pubmed - Elhayany A, Lustman A, Abel R, Attal-Singer J, Vinker S. A low carbohydrate Mediterranean diet improves cardiovascular risk factors and diabetes control among overweight patients with type 2 diabetes mellitus: a 1-year prospective randomized intervention study. Diabetes Obes Metab. 2010;12(3):204-209.
doi pubmed - Gardner CD, Kiazand A, Alhassan S, Kim S, Stafford RS, Balise RR, Kraemer HC, et al. Comparison of the Atkins, Zone, Ornish, and LEARN diets for change in weight and related risk factors among overweight premenopausal women: the A TO Z Weight Loss Study: a randomized trial. JAMA. 2007;297(9):969-977.
doi pubmed - Guldbrand H, Lindstrom T, Dizdar B, Bunjaku B, Ostgren CJ, Nystrom FH, Bachrach-Lindstrom M. Randomization to a low-carbohydrate diet advice improves health related quality of life compared with a low-fat diet at similar weight-loss in Type 2 diabetes mellitus. Diabetes Res Clin Pract. 2014;106(2):221-227.
doi pubmed - Saslow LR, Kim S, Daubenmier JJ, Moskowitz JT, Phinney SD, Goldman V, Murphy EJ, et al. A randomized pilot trial of a moderate carbohydrate diet compared to a very low carbohydrate diet in overweight or obese individuals with type 2 diabetes mellitus or prediabetes. PLoS One. 2014;9(4):e91027.
doi pubmed - Shai I, Schwarzfuchs D, Henkin Y, Shahar DR, Witkow S, Greenberg I, Golan R, et al. Weight loss with a low-carbohydrate, Mediterranean, or low-fat diet. N Engl J Med. 2008;359(3):229-241.
doi pubmed - Stern L, Iqbal N, Seshadri P, Chicano KL, Daily DA, McGrory J, Williams M, et al. The effects of low-carbohydrate versus conventional weight loss diets in severely obese adults: one-year follow-up of a randomized trial. Ann Intern Med. 2004;140(10):778-785.
doi pubmed - Westman EC, Yancy WS, Jr., Mavropoulos JC, Marquart M, McDuffie JR. The effect of a low-carbohydrate, ketogenic diet versus a low-glycemic index diet on glycemic control in type 2 diabetes mellitus. Nutr Metab (Lond). 2008;5:36.
doi pubmed - Kontodimopoulos N, Arvanitaki E, Aletras VH, Niakas D. Psychometric properties of the Greek Diabetes Treatment Satisfaction Questionnaire. Health Qual Life Outcomes. 2012;10:17.
doi pubmed - Sterne JA, White IR, Carlin JB, Spratt M, Royston P, Kenward MG, Wood AM, et al. Multiple imputation for missing data in epidemiological and clinical research: potential and pitfalls. BMJ. 2009;338:b2393.
doi pubmed - Azur MJ, Stuart EA, Frangakis C, Leaf PJ. Multiple imputation by chained equations: what is it and how does it work? Int J Methods Psychiatr Res. 2011;20(1):40-49.
doi pubmed - Davis NJ, Tomuta N, Schechter C, Isasi CR, Segal-Isaacson CJ, Stein D, Zonszein J, et al. Comparative study of the effects of a 1-year dietary intervention of a low-carbohydrate diet versus a low-fat diet on weight and glycemic control in type 2 diabetes. Diabetes Care. 2009;32(7):1147-1152.
doi pubmed - Feinman RD, Pogozelski WK, Astrup A, Bernstein RK, Fine EJ, Westman EC, Accurso A, et al. Dietary carbohydrate restriction as the first approach in diabetes management: critical review and evidence base. Nutrition. 2015;31(1):1-13.
doi pubmed
This article is distributed under the terms of the Creative Commons Attribution Non-Commercial 4.0 International License, which permits unrestricted non-commercial use, distribution, and reproduction in any medium, provided the original work is properly cited.
Journal of Clinical Medicine Research is published by Elmer Press Inc.