


| Journal of Clinical Medicine Research, ISSN 1918-3003 print, 1918-3011 online, Open Access |
| Article copyright, the authors; Journal compilation copyright, J Clin Med Res and Elmer Press Inc |
| Journal website http://www.jocmr.org |
Original Article
Volume 9, Number 1, January 2017, pages 40-45
Feasibility Study of Computational Fluid Dynamics Simulation of Coronary Computed Tomography Angiography Based on Dual-Source Computed Tomography
Jing Lua, Jie Yub, Heshui Shib, c
aNuclear Medicine Department, ZhongShan Hospital Xiamen University, No. 201-209, Hubin South Road, Xiamen, China
bDepartment of Radiology, Wuhan Union Hospital, No. 1277, Jiefang Road, Wuhan, China
cCorresponding Author: Heshui Shi, Department of Radiology, Wuhan Union Hospital, No. 1277, Jiefang Road, Wuhan, China
Manuscript accepted for publication June 30, 2016
Short title: Feasibility Study of CFD Simulation of CCTA
doi: https://doi.org/10.14740/jocmr2623w
| Abstract | ▴Top |
Background: Adding functional features to morphological features offers a new method for non-invasive assessment of myocardial perfusion. This study aimed to explore technical routes of assessing the left coronary artery pressure gradient, wall shear stress distribution and blood flow velocity distribution, combining three-dimensional coronary model which was based on high resolution dual-source computed tomography (CT) with computational fluid dynamics (CFD) simulation.
Methods: Three cases of no obvious stenosis, mild stenosis and severe stenosis in left anterior descending (LAD) were enrolled. Images acquired on dual-source CT were input into software Mimics, ICEMCFD and FLUENT to simulate pressure gradient, wall shear stress distribution and blood flow velocity distribution. Measuring coronary enhancement ratio of coronary artery was to compare with pressure gradient.
Results: Results conformed to theoretical values and showed difference between normal and abnormal samples.
Conclusions: The study verified essential parameters and basic techniques in blood flow numerical simulation preliminarily. It was proved feasible.
Keywords: Dual-source CT; Coronary computed tomography angiography; Computational fluid dynamics; Pressure gradient; Wall shear stress distribution; Flow velocity distribution
| Introduction | ▴Top |
Hemodynamic changes led by atherosclerotic lesions in coronary arteries, such as intravascular pressure blood flow gradient changes and coronary flow reserve changes, are closely related to myocardial ischemia. Monitoring hemodynamic changes can guide revascularization, thus leading the maximum benefits to patients and avoiding adverse outcomes. It is more significant to evaluate hemodynamic changes than morphological changes only. Computational fluid dynamics (CFD) is an interdisciplinary of computer technology and fluid physics. Fluid dynamics parameters within coronary arteries, including blood pressure distribution, wall shear stress (WSS) distribution and velocity distribution, can be derived by combining coronary artery three-dimensional data, which were obtained by computed tomography (CT) scans, with CFD. Adding functional features to morphological features offers a new method for non-invasive assessment of myocardial perfusion [1]. The main purpose of this study was to explore technical routes of assessing the left coronary artery pressure gradient, WSS distribution and blood flow velocity distribution, combining three-dimensional coronary model which was based on high-resolution dual-source CT with CFD simulation.
| Materials and Methods | ▴Top |
This was a retrospective study enrolled with three patients who underwent dual-source coronary computed tomography angiography (CCTA) between March and April in 2014. Case 1 was a 35-year-old male patient with no obvious stenosis in the left anterior descending (LAD). Case 2 was a 65-year-old male patient with mild stenosis in the LAD (a stenosis of 20% in the proximal-middle segments of LAD diagnosed by CCTA). Case 3 was a 60-year-old male patient with severe stenosis in the LAD (a stenosis of 90% in the proximal segments of LAD diagnosed by CCTA, Fig. 1).
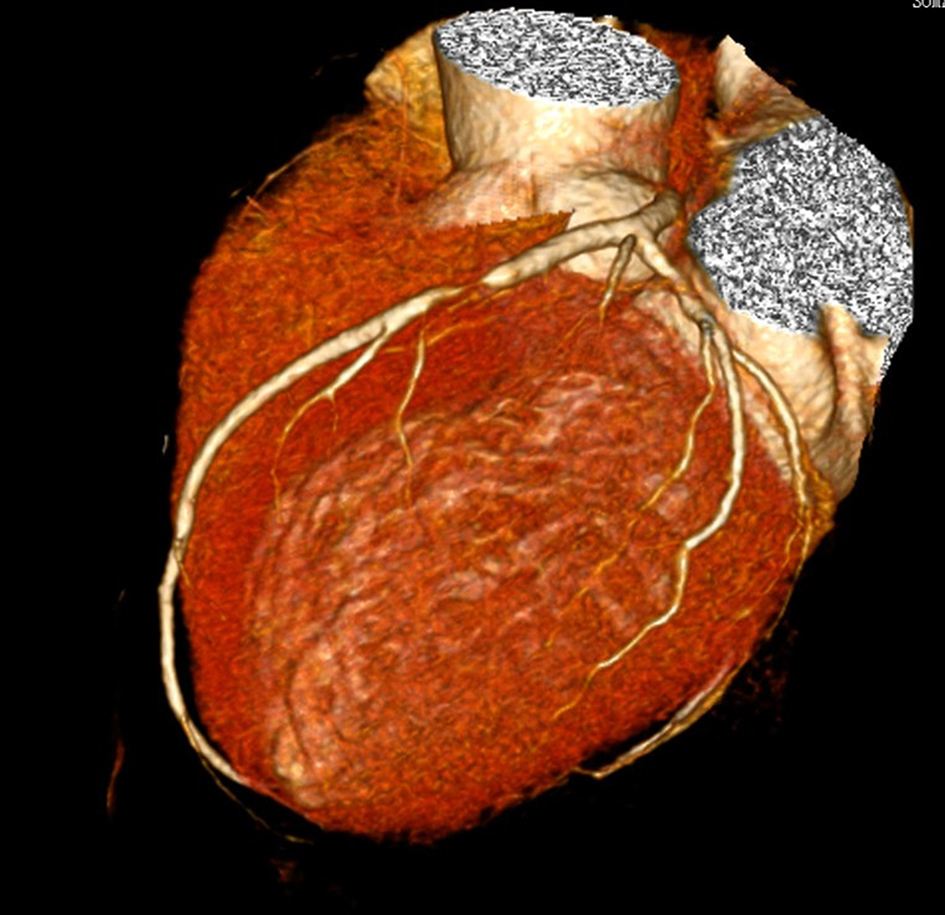 Click for large image | Figure 1. Patient of case 3 was male and 60 years old. CCTA showed severe stenosis of 90% in the proximal segments of LAD. |
CCTA acquisition and analysis protocol
CCTA was performed by using retrospective electrocardiographic gating and dual-source CT (Siemens Somatom Definition, Germany). The scan was acquired during injection of 70 mL of Lomeprol (Bracco) at 4.0 mL/s, followed by 40 mL of saline at the same rate. Scans were automatically triggered by using bolus tracking when the contrast attenuation reached 100 HU in the ascending aorta. Scan parameters were as follows: tube current, 300 - 500 mA depending on body mass index and tube voltage both fixed at 120 kV. Oral b-blockers were administered by targeting a heart rate of less than 75 beats per minute, and sublingual nitrates were administered immediately before the scan to optimize coronary vasodilatation.
CFD simulation
Two methods were used to build three-dimensional luminal model of the left coronary arteries. CCTA data used for geometry construction corresponded to end-diastole. The first method was to input complete original axial images into software Mimics 10.01 (Materialise, Belgium) and extract soft tissues to build complete coronaries artery model by identifying gray scales. Then the left coronary arteries model was kept only. The second one was to rebuild axial images as follows: field of view (FOV) 200 × 200 mm, the left coronary arteries only without chambers or myocardium, and then generate the model in software Mimics directly (Fig. 2).
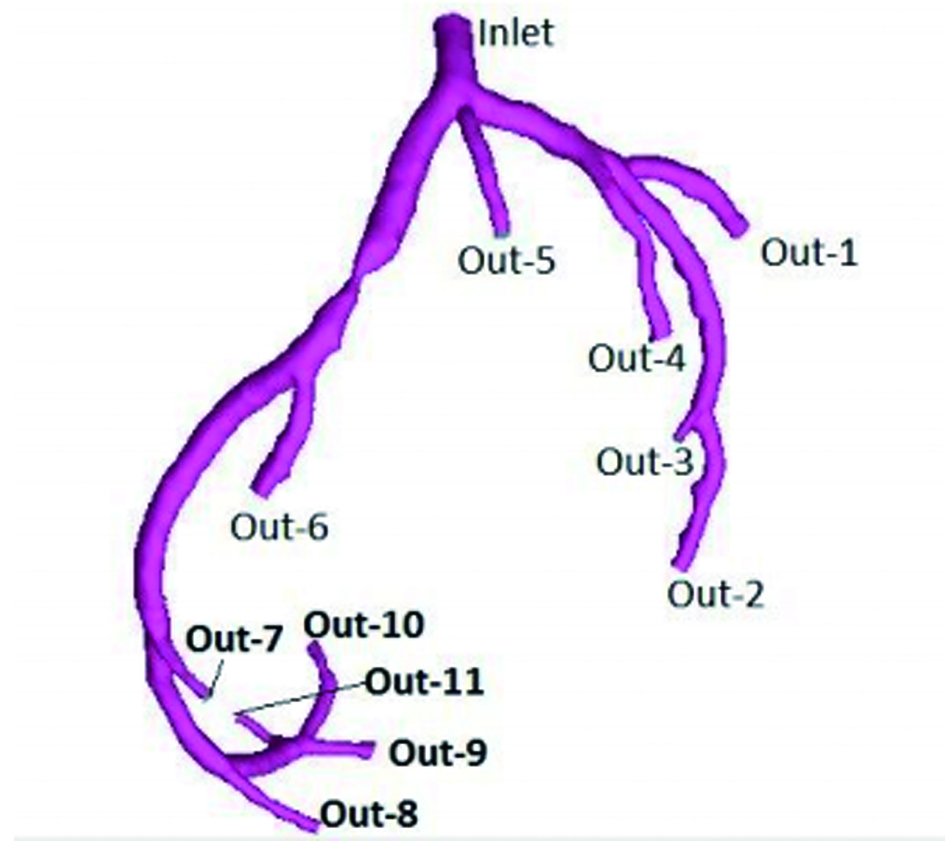 Click for large image | Figure 2. Patient of case 3 was male and 60 years old. Three-dimensional luminal model of the left coronary arteries was generated in software Mimics. Inlet was defined as entry of flow. Out-1 to Out-11 were set as free flow boundary. |
The three-dimensional model was input into software ICEMCFD 12.0 (ANSYS, USA) for grid generation. Five kinds of densities of mesh were undertaken to test the relationship between overall numbers of grid and computation which was described in a graph: overall numbers as abscissa and pressure descending of the LAD as ordinate (Fig. 3a, b). The total number of grid ranged from about 240,000 to 4,660,000, and part of the diagram is shown in Figure 3 (case 2 as the example). It turned out that computation was more accurate with more numbers of grids. So choosing the minimum numbers of grids which would not change computation could raise efficiency and guarantee veracity.
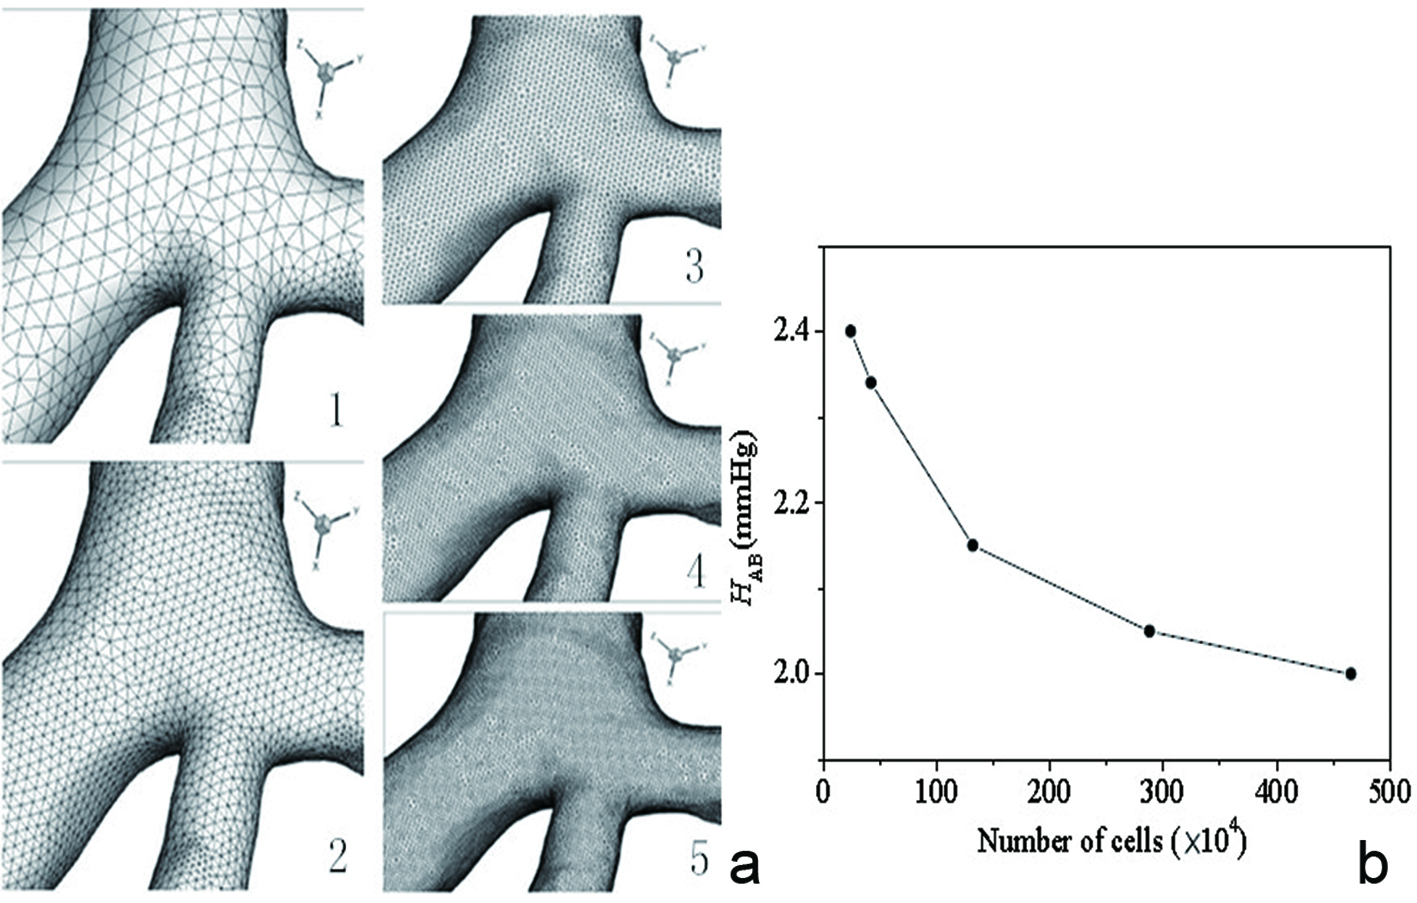 Click for large image | Figure 3. Part of the diagram of five kinds of densities of mesh of case 2 (a). The total number of grid ranged from about 240,000 to 4,660,000. The relationship between overall numbers of grid and computation which was described in a graph (b): overall numbers as abscissa and pressure descending of the LAD as ordinate. Pressure gradient change was in line with the trend of overall numbers of grid and differences were getting smaller. |
According to the graph of coronary arteries flow changes during cardiac cycle which was reported by Chaichana et al, quantity of flow of the entry of the left coronary artery (Inlet) was determined (Fig. 4) [2]. The exports were set as free flow boundary (Out-1 to 11), and the flow allocation was determined by diameter of each export depending on Murray law [3]. The following assumptions were made as such [4-6]: 1) the vessel walls were smooth, rigid and non-porous; 2) the blood was considered incompressible, Newtonian fluid obeying Navier-Stokes equations; 3) the blood viscosity was 0.0035 Pas, and blood density equaled 1,060 kg/m3; and 4) the flow was unsteady laminar. After grid division and setting boundary conditions, the left coronary arteries model was imported into software FLUENT 12.0 (ANSYS, USA) to simulate flow pressure gradient (the entry was one), WSS distribution and blood flow velocity distribution of the LAD. Pseudo-color images were generated in the end.
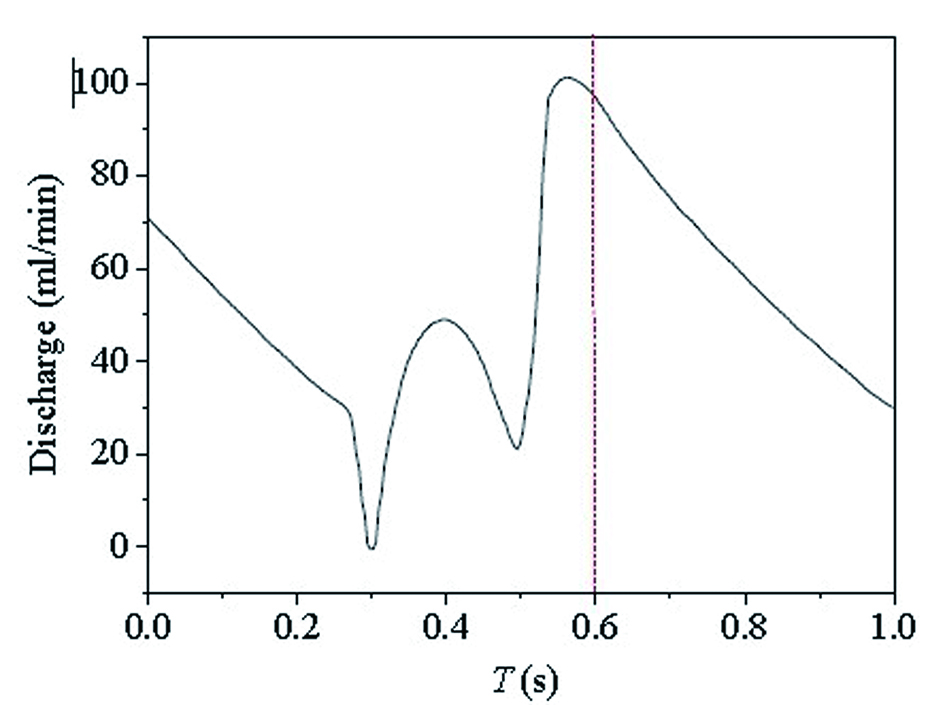 Click for large image | Figure 4. The graph of coronary arteries flow changes during cardiac cycle was reported by Chaichana et al [2]: time as abscissa (s) and quantity of flow as ordinate (mL/min). Flow of the entry of the left coronary artery (inlet) at different moment could be acquired. |
Measurement of flow pressure gradient and CT values gradient in coronary artery
The three segments of LAD (proximal, middle and distal segment) were divided into three parts averagely and severally, and then mean values of each segment were computed according to simulation and CT values, excluding luminal wall, plaques or calcifications. Flow pressure gradient and CT values of both ends of stenosis of cases 2 and 3 were recorded. Coronary enhancement ratio (CER) was CT values above mentioned/CT values of aortic root.
| Results | ▴Top |
It took 30 h with first method and 10 h with second method in reconstructing three-dimensional luminal model in software Mimics. Pressure gradient changes were in line with the trend of overall numbers of grid and differences were getting smaller. In case 2, it had little effect on computation with total number of more than 2,880,000. So the forth result of mesh was determined.
CFD simulations of the LAD included pressure gradient which was the coronary artery pressure relative to the entry (Fig. 5a1-a2), WSS distribution (Fig. 5b1-b2) and blood flow velocity distribution (Fig. 5c1-c2), which were all described with color gradation. Blue meant low values and red was high values. There was little descending in the pressure gradient of cases 1 and 2. But compared to the normal left circumflex artery (LCA), the descending in the pressure gradient of case 3 between both ends of stenosis of LAD was large. WSS values in lumen without plaques or stenosis in three cases were low and uniform. At regions opposite to the flow divider, dominant low WSS values occurred. In case 3, WSS values of severe stenosis were higher. Blood flow velocity distributed uniformly in the LAD of cases 1 and 2, and center axial flow was faster than border flow. Blood flow velocity gradient barely changed in the stenosis segment of case 2. But there was obvious variation in LAD of case 3: acceleration of flow velocity on both ends of stenosis, the fastest flow velocity in the center of stenosis and obvious turbulence after end of stenosis.
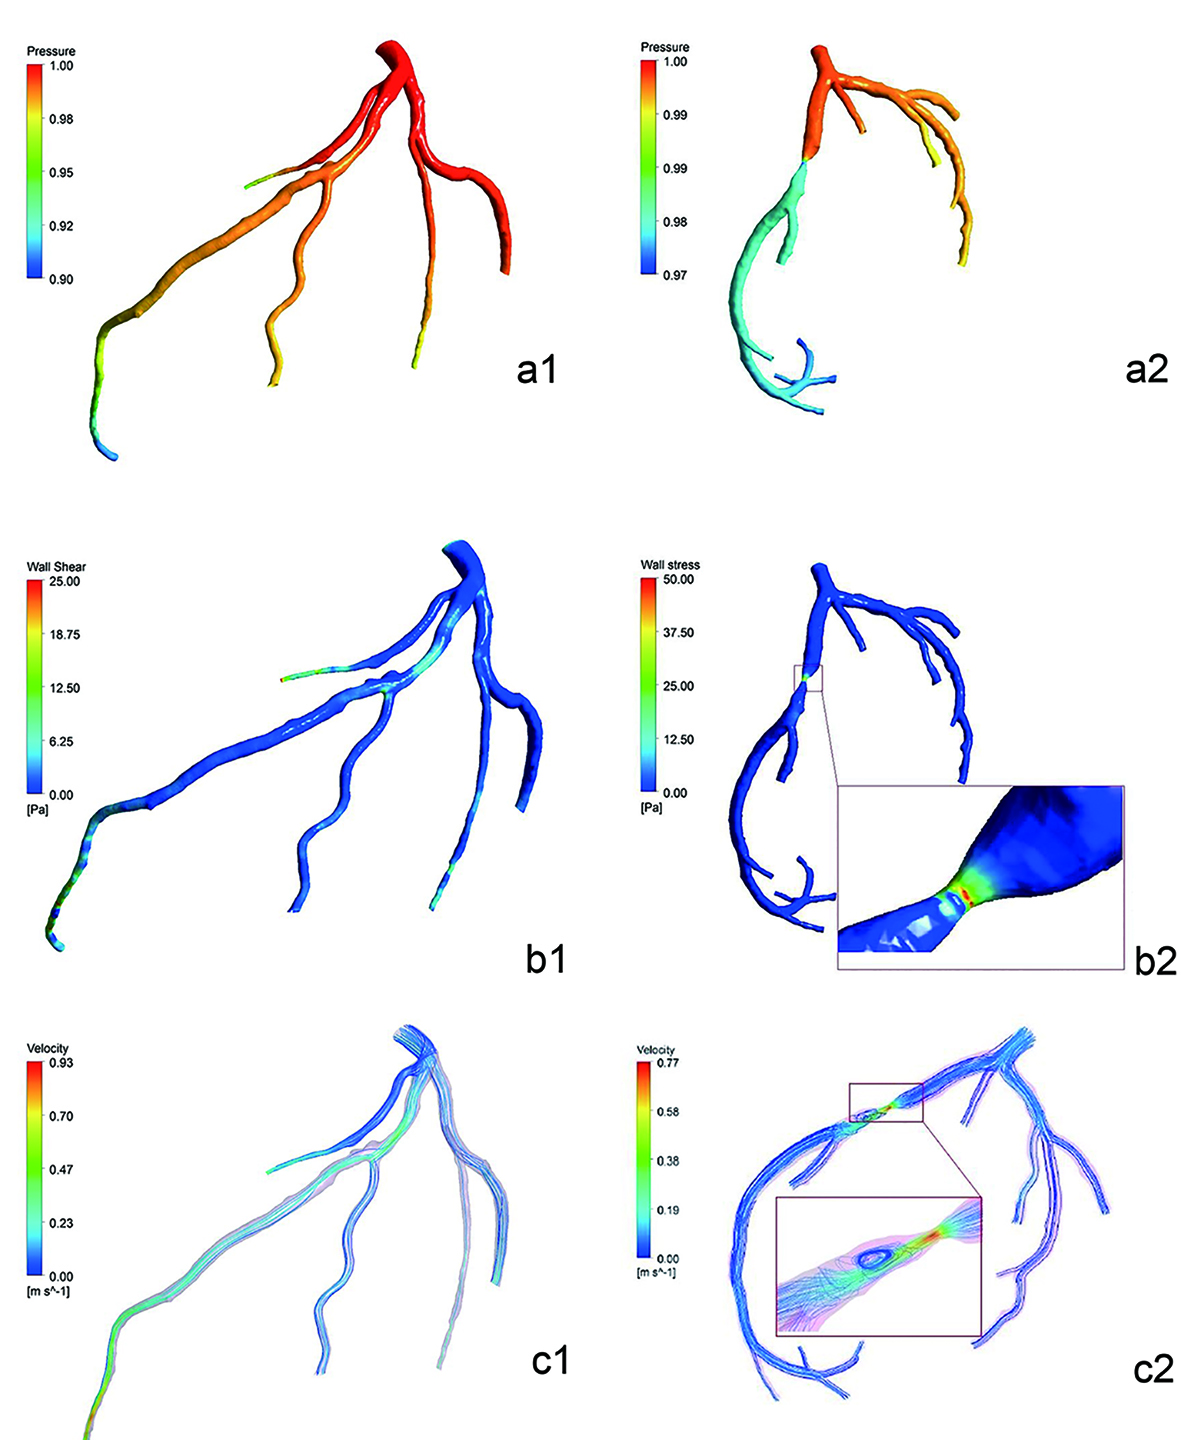 Click for large image | Figure 5. Pressure distribution simulated diagram of cases 2 and 3 (the entry was one) (a1-a2). There was little descending in the pressure gradient of case 2. But the descending in the color difference which was pressure gradient of case 3 between proximal and distal of stenosis of LAD was large. Noteworthy reduction of pressure was observed in the distal segment of left septal branch of case 2. It showed the WSS distribution simulated diagram of cases 2 and 3 (Pa) (b1-b2). WSS values in lumen without plaques or stenosis were low and uniform. At regions opposite to the flow divider, dominant low WSS values occurred. In case 3, WSS values of severe stenosis were higher. It showed the flow velocity distribution simulated diagram of cases 2 and 3 (m/s) (c1-c2). Blood flow velocity distributed uniformly in the LAD, and center axial flow was faster than border flow. Blood flow velocity gradient barely changed in the stenosis segment of case 2. But there was obvious variation in LAD of case 3: acceleration of flow velocity on both ends of stenosis, the fastest flow velocity in the center of stenosis, obvious turbulence after end of stenosis. |
Table 1 lists the mean values of flow pressure gradient and CER in the LAD of three cases. Differences of pressure gradient and CER values between both ends of severe stenosis of case 3 were larger than mild stenosis of case 2.
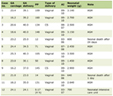 Click to view | Table 1. Comparison of the Mean Values of Flow Pressure Gradient and CER in the LAD of Three Cases (x ± s) |
| Discussion | ▴Top |
The difference of time between two methods in building three-dimensional luminal model was large, indicating that it shortened much time with partial axial images and simplified the process. Choosing appropriate numbers of grid which guarantee quality of computation would shorten process too. Compared to FFRCT which was based on super computers in DICOVER-FLOW and DeFACTO study [7, 8], this study applied workstation with relevant softwares and cost lower. What mentioned above had better clinical practicability.
The trends of flow pressure gradient and CER values of LAD of three cases were roughly same. It detected pressure difference between both ends of stenosis of case 3 in CFD simulation sensitively, which was in line with CER values of corresponding segments. It was reported that CER values were significantly different between both ends of stenosis of more than 50% by Nagao et al [8, 9]. According to Steigner et al and Wong et al, CT values gradient in coronary arteries could predict myocardial ischemia related to stenosis [10, 11]. Thus, CFD simulation might predict myocardial ischemia too and show it to clinicians and patients with pseudo-color images intuitively. Noteworthy reduction of pressure was observed in the distal segment of left septal branch of case 2 because of direct oppression from myocardium and high resistance. Besides, colors of left main coronary artery and LAD were inconformity in the two cases shown in Figure 5a1-a2. The reason was lack of revision of pseudo color of case 3. It would not affect evaluation of pressure gradient but it did remind researchers to avoid similar bias in follow-up work.
WSS distribution in coronary arteries was related to force at points of bifurcation. Low WSS values occurred at regions opposite to the flow divider. Low WSS values were possibly correlated to the localization of atherosclerotic lesions. And the distribution was in accordance with the localization of atherosclerotic lesions in this area. High curvature and severe stenosis affected the velocity distribution at the flow divider, giving rise to high WSS values, which led to hemorrhage and rupture in atherosclerotic lesions [6, 12, 13].
The assumption made about the nature of the flow was that it was incompressible Newtonian fluid according to studies domestic and overseas at present. Some researchers underwent studies to compare Newtonian fluid models and non-Newtonian fluid models which reported similar WSS distributions and different velocity distributions. As non-Newtonian fluid model, axial velocity at curve regions tended to be more gentle, limiting diffusion of contrast agent [4, 14-17]. Thus in this study measurement of CER values at curve regions might be affected. Even so, the study offered technical assistance to CFD simulation of non-Newtonian fluid model and flexible vessel walls.
CCTA images based on dual-source CT were acquired during several cardiac cycles. In follow-up studies, 320-detector row CT will be used to get time-uniformity coronary arteries images. Thus measurement of CT values gradient can be more accurate. But its temporal resolution is low so it requires lower heart rates during examination. With a heart rate of less than 70 beats per minute, the scan can be accomplished in one cardiac cycle which means time-uniformity. Otherwise it needs to scan two or more cycles and multi-sectors reconstructions to improve resolution, with more time of exposure and radiation dose [18].
Conclusion
The study verified essential parameters and basic techniques in blood flow numerical simulation preliminarily. Results conformed to theoretical values and showed difference between normal and abnormal samples. The study was proved feasible.
This study had limitations. Parameters were assumptions according to theories and short of actual measurement including initial conditions, flow distribution ratio and outflow boundary conditions. Three-dimensional luminal model of the left coronary arteries were not reconstructed with multi-phases limiting to temporal resolution. Results of three cases were not validated by pressure wire. Patients were scanned under resting state in this study. However, Chow et al [19] reported that CT values gradient might be more sensitive and precise under stressing state, which will be solved in follow-up studies.
Conflicts of Interest
The authors have declared no conflicts of interest.
Funding Support
The study was supported by National Natural Science Foundation of China (No. 81271570).
| References | ▴Top |
- Liu Y, Qiao A, Huang W, et al. Advance in Hemodynamics Numerical Simulation and Atherosclerosis. Advances In Mechanics. 2002;32(3):435-443.
- Chaichana T, Sun Z, Jewkes J. Computational fluid dynamics analysis of the effect of plaques in the left coronary artery. Comput Math Methods Med. 2012;2012:504367.
doi pubmed - Painter PR, Eden P, Bengtsson HU. Pulsatile blood flow, shear force, energy dissipation and Murray's Law. Theor Biol Med Model. 2006;3:31.
doi pubmed - Xue Y, Gao P, Lin Y, et al. Analysis of hemodynamics in patient-specific stenotic carotid bifurcation using computational fluid dynamics and MR angiography. Chinese Journal Of Radiology. 2007;41(4):337-340.
- Soulis JV, Farmakis TM, Giannoglou GD, Louridas GE. Wall shear stress in normal left coronary artery tree. J Biomech. 2006;39(4):742-749.
doi pubmed - Mohammadi H, Bahramian F. Boundary conditions in simulation of stenosed coronary arteries. Cardiovasc Eng. 2009;9(3):83-91.
doi pubmed - Koo BK, Erglis A, Doh JH, Daniels DV, Jegere S, Kim HS, Dunning A, et al. Diagnosis of ischemia-causing coronary stenoses by noninvasive fractional flow reserve computed from coronary computed tomographic angiograms. Results from the prospective multicenter DISCOVER-FLOW (Diagnosis of Ischemia-Causing Stenoses Obtained Via Noninvasive Fractional Flow Reserve) study. J Am Coll Cardiol. 2011;58(19):1989-1997.
doi pubmed - Yu J, Shi H, Han P. Research Progress of Evaluation of Coronary Arterial Blood Flow Dynamics on Multislice CT. Chinese Journal Of Radiology. 2013;47(5):462-464.
- Nagao M, Kido T, Watanabe K, Saeki H, Okayama H, Kurata A, Hosokawa K, et al. Functional assessment of coronary artery flow using adenosine stress dual-energy CT: a preliminary study. Int J Cardiovasc Imaging. 2011;27(3):471-481.
doi pubmed - Steigner ML, Mitsouras D, Whitmore AG, Otero HJ, Wang C, Buckley O, Levit NA, et al. Iodinated contrast opacification gradients in normal coronary arteries imaged with prospectively ECG-gated single heart beat 320-detector row computed tomography. Circ Cardiovasc Imaging. 2010;3(2):179-186.
doi pubmed - Wong DT, Ko BS, Cameron JD, Nerlekar N, Leung MC, Malaiapan Y, Crossett M, et al. Transluminal attenuation gradient in coronary computed tomography angiography is a novel noninvasive approach to the identification of functionally significant coronary artery stenosis: a comparison with fractional flow reserve. J Am Coll Cardiol. 2013;61(12):1271-1279.
doi pubmed - Sadat U, Teng Z, Gillard JH. Biomechanical structural stresses of atherosclerotic plaques. Expert Rev Cardiovasc Ther. 2010;8(10):1469-1481.
doi pubmed - Helderman F, Segers D, de Crom R, Hierck BP, Poelmann RE, Evans PC, Krams R. Effect of shear stress on vascular inflammation and plaque development. Curr Opin Lipidol. 2007;18(5):527-533.
doi pubmed - Zhang Q, Gao B, Gu K, Chang Y, Xu J, Deuflhard P. The Effect of Varied Support Models of BJUT-IIVAD on Coronary Arterial blood flow and wall shear stress: A Primary CFD Study. ASAIO J. 2014.
doi - Sun Z, Xu L. Computational fluid dynamics in coronary artery disease. Comput Med Imaging Graph. 2014;38(8):651-663.
doi pubmed - Schmidt R, Graafen D, Weber S, Schreiber LM. Computational fluid dynamics simulations of contrast agent bolus dispersion in a coronary bifurcation: impact on MRI-based quantification of myocardial perfusion. Comput Math Methods Med. 2013;2013:513187.
doi pubmed - Yang J, Liu J, Yu H, et al. Comparison of hemodynamics in iliac aortic with thrombosis and normal iliac aortic based on numerical simulation. Biomedical Engineering and Clinical Medicine. 2012;16(1):1-6.
- Sun G, Li M, Jiang XS, Li L, Peng ZH, Li GY, Xu L. 320-detector row CT coronary angiography: effects of heart rate and heart rate variability on image quality, diagnostic accuracy and radiation exposure. Br J Radiol. 2012;85(1016):e388-394.
doi pubmed - Chow BJ, Kass M, Gagne O, Chen L, Yam Y, Dick A, Wells GA. Can differences in corrected coronary opacification measured with computed tomography predict resting coronary artery flow? J Am Coll Cardiol. 2011;57(11):1280-1288.
doi pubmed
This is an open-access article distributed under the terms of the Creative Commons Attribution-NonCommercial 4.0 International License, which permits unrestricted non-commercial use, distribution, and reproduction in any medium, provided the original work is properly cited.
Journal of Clinical Medicine Research is published by Elmer Press Inc.