


| Journal of Clinical Medicine Research, ISSN 1918-3003 print, 1918-3011 online, Open Access |
| Article copyright, the authors; Journal compilation copyright, J Clin Med Res and Elmer Press Inc |
| Journal website http://www.jocmr.org |
Original Article
Volume 8, Number 9, September 2016, pages 633-640
Improving Clinical Practice Using a Novel Engagement Approach: Measurement, Benchmarking and Feedback, A Longitudinal Study
John W. Peabodya, b, c, David R. Paculdoa, Diana Tamondong-Lachicaa, Jhiedon Florentinoa, Othman Ouenesa, Riti Shimkhadaa, Lisa DeMariaa, Trever B. Burgona
aQURE Healthcare, 450 Pacific Ave., Suite 200, San Francisco, CA 94133, USA
bUniversity of California, San Francisco and Los Angeles, CA, USA
cCorresponding Author: John W. Peabody, Global Health Sciences, University of California, San Francisco, and QURE Healthcare, 450 Pacific Ave., Suite 200, San Francisco, CA 94133, USA
Manuscript accepted for publication June 24, 2016
Short title: Improving Evidence-Based Clinical Practice
doi: http://dx.doi.org/10.14740/jocmr2620w
| Abstract | ▴Top |
Background: Poor clinical outcomes are caused by multiple factors such as disease progression, patient behavior, and structural elements of care. One other important factor that affects outcome is the quality of care delivered by a provider at the bedside. Guidelines and pathways have been developed with the promise of advancing evidence-based practice. Yet, these alone have shown mixed results or fallen short in increasing adherence to quality of care. Thus, effective, novel tools are required for sustainable practice change and raising the quality of care.
Methods: The study focused on benchmarking and measuring variation and improving care quality for common types of breast cancer at four sites across the United States, using a set of 12 Clinical Performance and Value® (CPV®) vignettes per site. The vignettes simulated online cases that replicate a typical visit by a patient as the tool to engage breast cancer providers and to identify and assess variation in adherence to evidence-based practice guidelines and pathways.
Results: Following multiple rounds of CPV measurement, benchmarking and feedback, we found that scores had increased significantly between the baseline round and the final round (P < 0.001) overall and for all domains. By round 4 of the study, the overall score increased by 14% (P < 0.001), and the diagnosis with treatment plan domain had an increase of 12% (P < 0.001) versus baseline.
Conclusion: We found that serially engaging breast cancer providers with a validated clinical practice engagement and measurement tool, the CPVs, markedly increased quality scores and adherence to clinical guidelines in the simulated patients. CPVs were able to measure differences in clinical skill improvement and detect how fast improvements were made.
Keywords: Evidence-based medicine; Clinical oncology; Simulated patients; Medical education; Patient vignettes; Quality of care
| Introduction | ▴Top |
Poor clinical outcomes are caused by multiple factors such as disease progression, patient behavior, and structural elements of care including misaligned payment incentives. One other important factor is the quality of care delivered by a provider at the bedside [1-3]. Improving clinical care quality leads to better outcomes and lower costs [4]. Consequently, reducing unwarranted variation and addressing poor quality provider practice represent significant opportunities to improve patient outcomes. Effective interventions that make a positive impact in these areas are urgently needed, but traditional quality improvement tools have not worked well and practice change is difficult to implement [5].
Providers, health care systems and payers are looking for novel, more effective ways to raise the quality of care [6]. Metrics, dashboards, educational outreach, payment incentives, and other efforts to increase awareness and provide accountability have been tried but with only modest effects on reducing variation and raising quality [7-9]. More recently, guidelines and pathways promise advancing evidence-based practice to standardize care and reduce variation [10] but by themselves have shown mixed results [11].
Disappointments with guideline and pathway adherence, as well as earlier efforts to change clinician practice, may largely stem from the inability to meaningfully engage the physician (or other provider) and integrate learning improvement opportunities with practice change, patient outcomes, and costs of care [12, 13]. Effective provider engagement is linked to improved learning in a well-described process, a construct called “adult learning theory” [5]. Among the principles forming this construct are: 1) the ability to self-direct; 2) active learning; 3) work relevance; and 4) motivation to learn [14]. Successful learning interventions for providers thus requires clinically relevant tools using multi-modal content to actively engage users, taking into account different learning needs to deliver “just in time” information with feedback [15]. Put simply, traditional lectures or written guidelines and pathways are not enough.
Effective, novel tools are required for sustainable practice change and raising the quality of care. These tools should be tailored around familiar clinical encounters and test an individual clinician’s gaps in knowledge (work relevant). Ideally, the tool would provide users the flexibility to make clinical decisions as in real-world practice (self-direction), leverage peer performance comparisons (motivation to learn) and deliver individualized feedback of their performance (active learning) [5]. The “practice-learning environment” in this new concept of quality improvement is not distinct from patient care, but is driven by clinical context enriched by a variety of activities and using a tool that respects individual learning styles.
This is a multi-site, multi-program initiative, using practice-learning principles to educate and improve adherence to clinical pathways and evidence-based medicine in breast cancer practice. We used Clinical Performance and Value® (CPV®) vignettes as a novel educational tool to engage providers in a multi-modal educational experience that addressed individual gaps in knowledge and leveraged peer-to-peer benchmarking. The primary goal of the initiative was to determine if this approach engaged and motivated providers to be responsible for their own clinical education and see if they responded with better performance over time.
| Materials and Methods | ▴Top |
Study overview
The study was conducted at four sites across the United States: two National Cancer Institute designated sites, one multi-hospital health system, and one community-based oncology practice, and focused on measuring variation and improving care quality in breast cancer. Members of the four multi-disciplinary breast cancer teams included physicians, advance practice professionals, and other clinicians. Participants were asked to care for simulated patients, using CPV® vignettes via online interactive sessions [16], with serial engagements of measurement and feedback over four rounds of data collection. These rounds of measurement and feedback occurred every 4 months. The start and end dates varied across all sites, with all data being collected between June 2013 and November 2015.
Participants
The four sites included in the study were self-selected by site leadership to commit to having a platform for their clinical providers to give higher quality care. Individual providers were considered eligible for participation if they were employees or contractors at their respective sites who worked in the oncology service and had experience in the clinical care of breast cancer patients. In total, there were 87 providers who met the initial eligibility criteria. Providers were introduced to the study through onsite meetings at each of the four sites and were notified of their inclusion in the study. Providers could opt out by providing written communication to the authors. Neither their peers nor site leadership was notified of this action. Those who remained in the study were contacted via email and telephone to ensure they completed their simulated patients each round.
Engagement and measurement tool
The CPV simulated patient is cared for online and requires the clinician to respond to open-ended questions about the care they would deliver for the CPV patient. Each CPV takes approximately 20 - 30 min to complete and guides the participant through a typical patient encounter comprised of four standard domains of care: taking history, conducting the physical examination, ordering diagnostic workup, and diagnosing with a treatment plan (DxTx). Cases have explicit evidence-based scoring criteria and each participant’s responses are compared against those criteria by trained physician scorers.
CPVs measure a provider’s ability to evaluate, diagnose, and treat specific diseases and conditions in an actual care setting. They have been extensively validated against actual clinical care and have been shown to efficiently and accurately measure actual practice, not just clinician knowledge [16]. This measurement and feedback method has been used in a variety of care settings and multi-country comparisons [17] to measure variation, improve quality and outcomes, evaluate policies and lower costs by standardizing practice [18].
Cases
In this study, the CPV vignettes represented a range of typical breast cancer patients to the providers and were created to identify and assess variation in adherence to evidence-based practice guidelines and pathways. In all, two sets of 12 vignettes were created (Table 1). Cases ranged from ruling out cancerous breast lesions to treating early-stage breast cancer to managing more advanced disease. Determining which case set to use was made by hospital and practice leadership.
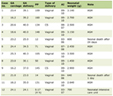 Click to view | Table 1. List of CPV Cases |
The scoring criteria for the cases were based on a number of sources, including National Comprehensive Cancer Network (NCCN) clinical practice guidelines, recommendations from oncology societies, and established relevant medical guidelines, as well as internal protocols and pathways designed by participating institutions. Trained physician abstractors, blinded to the vignette-taker’s identity, scored each vignette to capture on- and off-pathway/guideline care in history-taking, physical exam, workup studies ordered, and DxTx.
Prior to the start of the first round, each provider was asked to complete a short demographic survey. In each round, providers completed two CPV cases and received confidential feedback on each patient vignette they cared for via a personalized feedback report (Fig. 1). Individual feedback included an overall CPV quality score and specific scores for each domain of care, as well as personalized recommendations for improvement with links to clinical guidelines and the medical literature. In the feedback, individual scores were benchmarked against their colleagues.
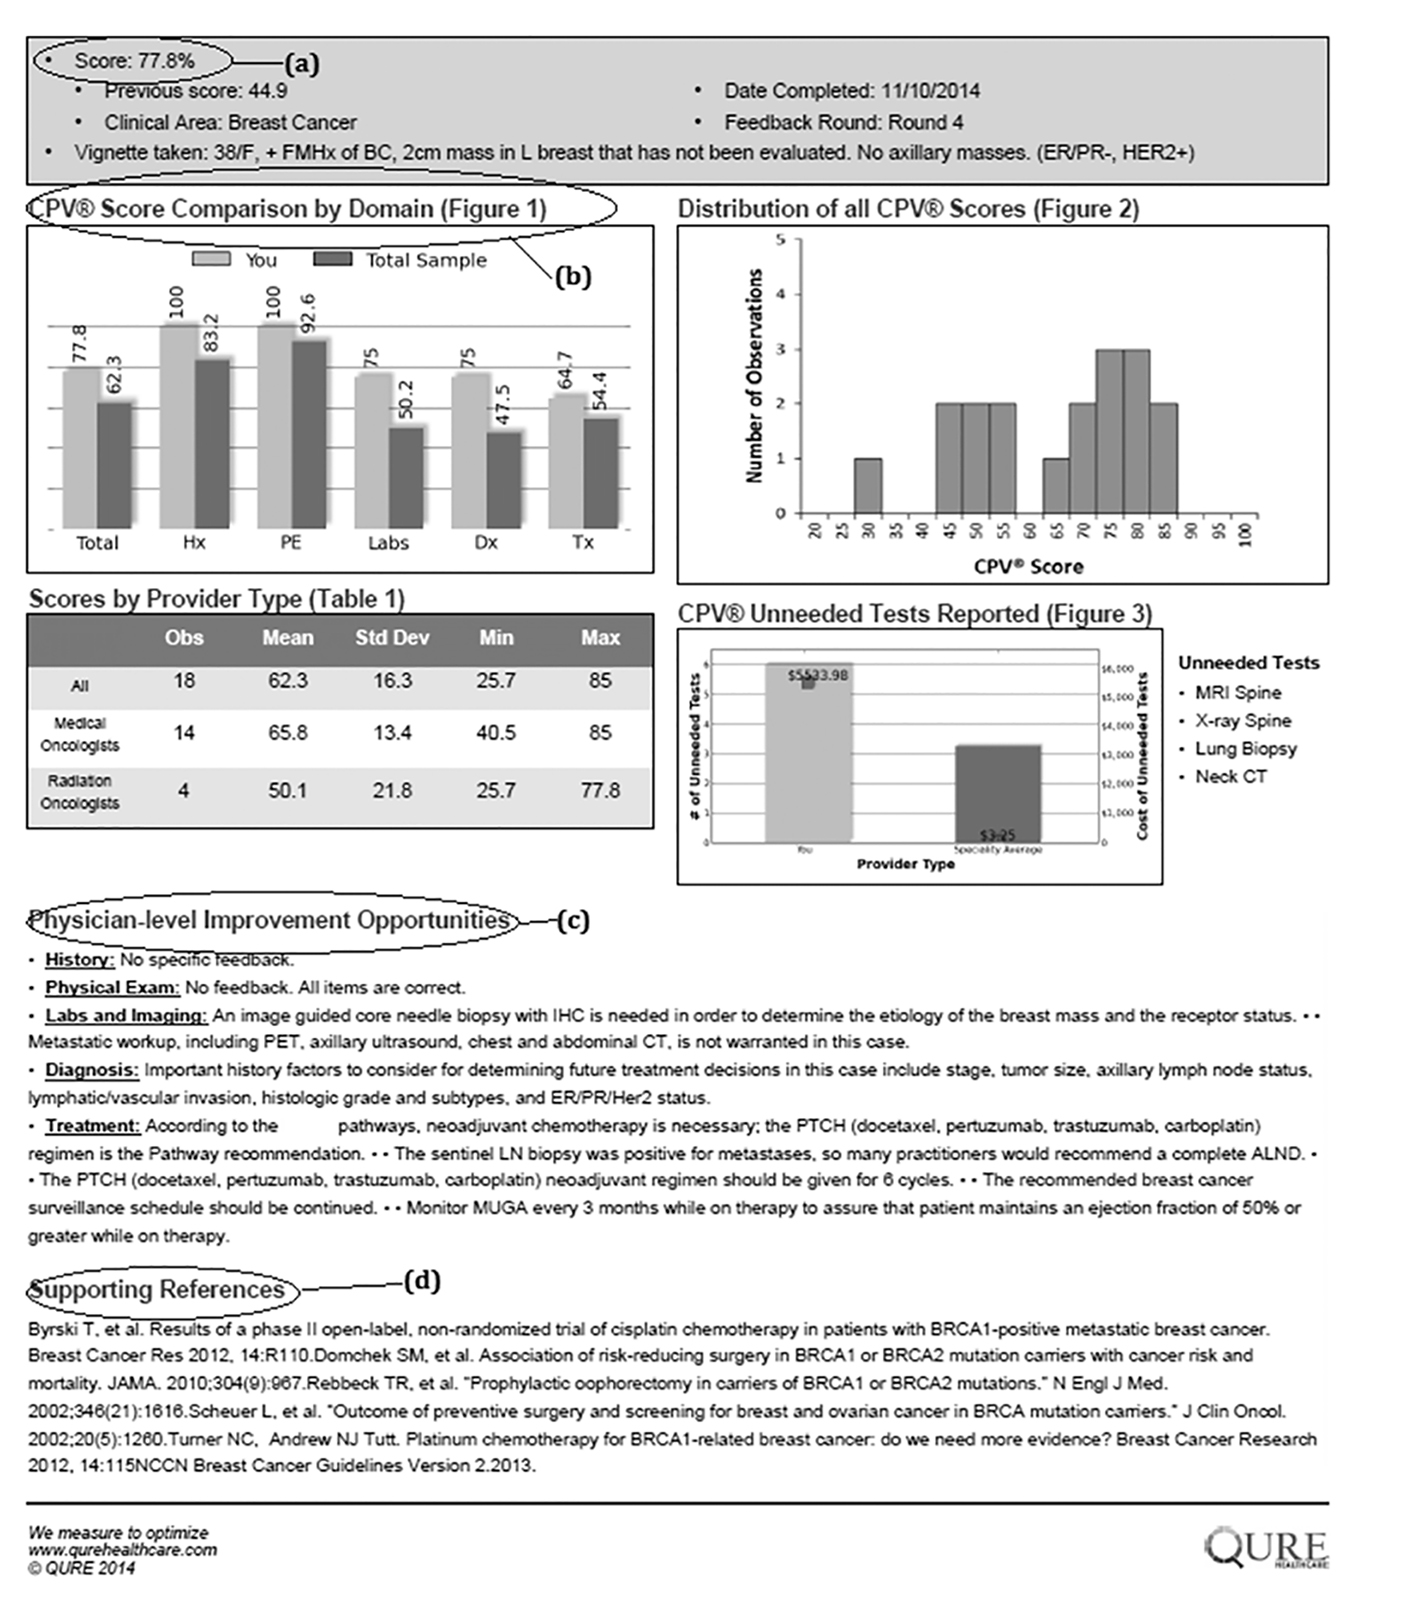 Click for large image | Figure 1. Example feedback form. |
In addition to individual-level feedback, providers at each site were engaged in group feedback sessions (either in-person or virtual) held after every round. Only aggregate group-level performance was shared with the participants at each site, and the group’s trends regarding adherence to pathways and guidelines were communicated. Importantly, the group-level feedback provided a structure and forum for providers to interact with each other concerning specific care pathways, areas of variation, and opportunities for collective improvement. In these hour-long sessions, quality of care themes were identified by leadership and used to create points of emphasis for additional physician engagement and improvement.
Data analysis
Do serial measurement, benchmarking and feedback (at individual and group levels) increase the CPV quality of care scores and adherence to evidence-based pathways over time? To examine this question, data were gathered to track clinician scores across rounds. The main outcomes of interest are the 1) overall vignette score, corresponding to the percentage of items correctly addressed by the participants according to the guideline-based scoring criteria; 2) domain scores: history, physical, workup, and DxTx; and 3) specific areas of care in the management of breast cancer (surgery, axillary management, radiation therapy, chemotherapy, and hormonal therapy). A two-sample variance-comparison test looked at whether use of CPVs decreased the variation in domain and overall scores between rounds. Analyses were conducted on specific subgroups, including provider type, percentage of breast cancer patients in the provider’s panel, and providers with high teaching loads.
Analyses were performed using Stata 13.1.
| Results | ▴Top |
In total, of the 87 total eligible providers, 81 participated in multiple rounds of the study and completed the introductory survey (Table 2). All six non-participating providers were excluded at the provider’s request. There was no significant difference found in provider characteristics between participators and non-participators.
Click to view | Table 2. Provider Characteristics, Overall and by Site |
Among sites, there was no significant difference in provider age, percentage of participants who were physicians, or years of experience. The average total case load per week per practitioner was 20.6, the average percentage of breast cancer patients seen (as a percentage of total case load) was 46.4%, and the average percentage of time spent on teaching activities was 14.2%. Using a Bonferroni correction, a one-way comparison of case load showed a significant difference only between sites 2 and 3 (P = 0.03), but was otherwise not significant. A similar comparison of the percentage of breast cancer patients seen showed a significant difference between all sites (P < 0.01, overall), except for sites 2 and 4 (P = 1.00). Time spent teaching was similar across all sites (P > 0.05), except sites 1 and 4 (P = 0.01) and sites 3 and 4 (P = 0.03).
There was a large amount of variability in overall CPV quality scores (Fig. 2). At baseline, the overall mean across all sites was 56.6% with a wide level of variation (range 22-84%). Average scores in workup (40.0%) and DxTx (45.6%) were substantially lower than the other two domains, similar to findings in other CPV studies [19]. DxTx scores also showed tremendous variation in practice with a range of 2.5-100%. Comparisons between the four sites at baseline showed no statistically significant difference in overall (P = 0.86) or DxTx (P = 0.94) scores.
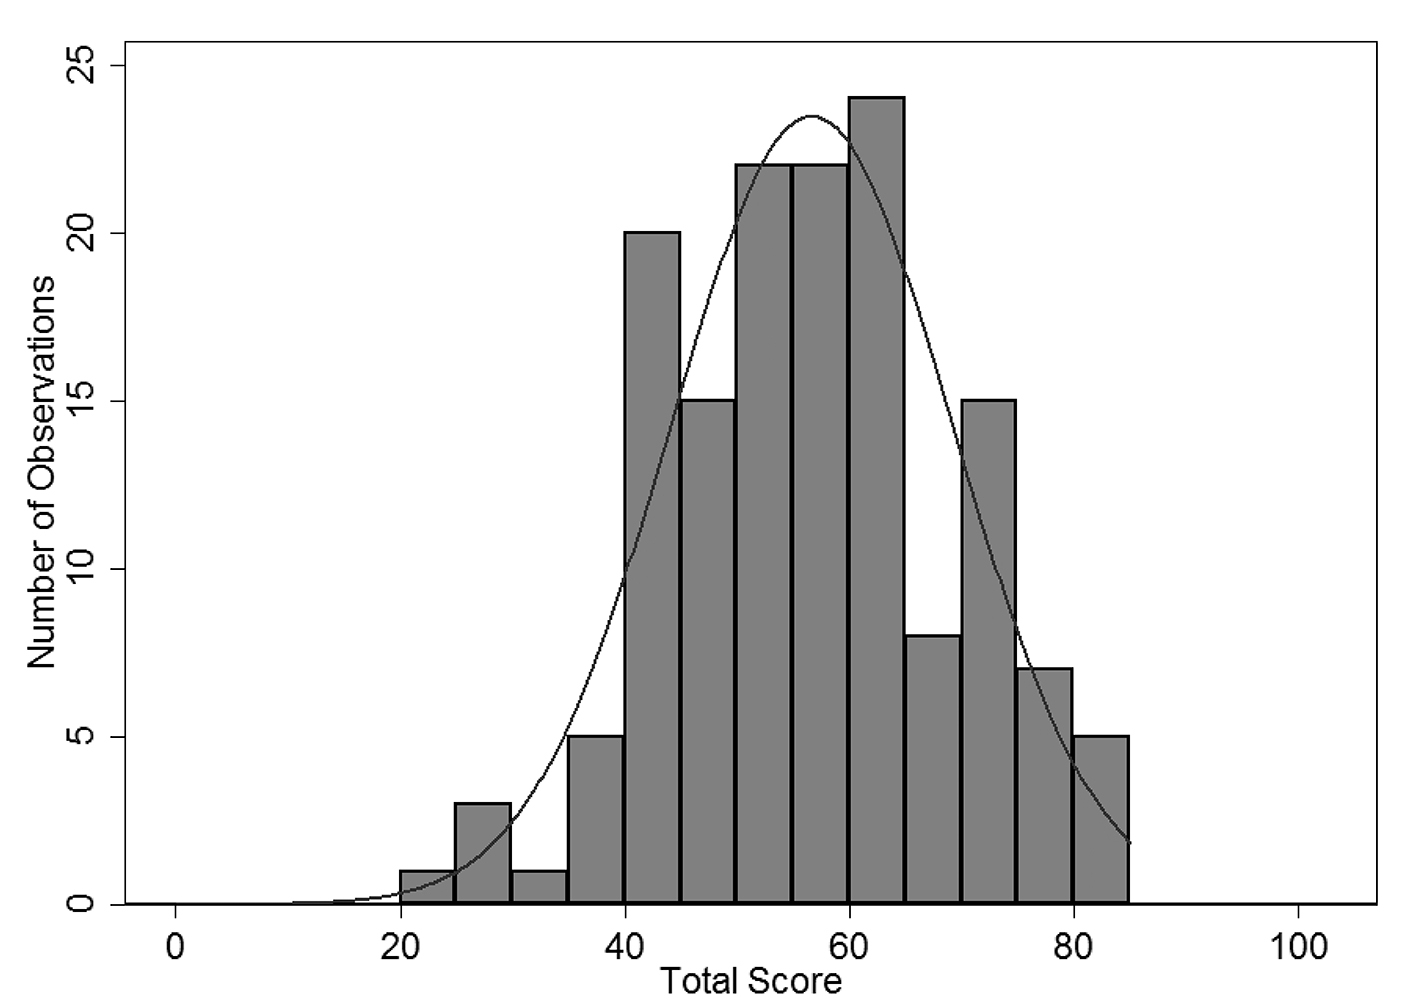 Click for large image | Figure 2. Round 1 overall CPV score for all provider sites. |
Following multiple rounds of CPV measurement, benchmarking and feedback, we compared performance in the baseline round with follow-up rounds (Table 3). Between baseline and round 4, the overall mean scores increased by nearly 14-70.5% (P < 0.01). Looking at the domain scores, significant increases were seen across all domains (P < 0.01 for each domain). Scores in the workup domain increased over 23% by round 4 (P < 0.01). Similarly, DxTx scores increased 12% versus baseline to 57.6% (P < 0.01).
Click to view | Table 3. Average Overall and Domain CPV Scores and Standard Deviation (SD) at Baseline and Subsequent Rounds |
We examined variation across rounds using a one-tail test of variance to compare changes in the standard deviation of the overall and domain scores between baseline and round four. The overall score showed a statistically significant increase in variation from 12.6% vs. 16.8% (P < 0.01), while the domain of history demonstrated a borderline significant increase in variation between baseline and round four (P = 0.06). Physical and workup domains had minor decreases in variations (P = 0.66 and 0.54, respectively), whereas DxTx variability had a much larger decrease from 20.8% to 18.6%, although this change was also not significant (P = 0.09).
Disaggregating the participants by percentage of time spent teaching, we found that variability decreased among those who reported spending less than 20% of their time teaching. At baseline, no significant difference was found in scores or variability between these two groups. For those who spent less time teaching, the overall score was an average of 3.6% higher (P = 0.06), and the related variability was 1.4% lower (P = 0.18). By round four those who reported more of their time seeing patients averaged 4.7% higher overall scores (P = 0.10) and with 5.7% less variability (P < 0.01) compared to those who reported more time teaching.
We next looked at specific areas of care in the management of breast cancer where adherence to the evidence base has proven problematic, including workup of the axilla and chemotherapy (Table 4). Comparing the baseline round and round 4, site 3 showed a marked increase in all five tracked areas, with percentage relative improvements ranging from 25% in hormonal therapy to over 100% in surgery. While the other sites did show improvement, they did not do so as uniformly as site 3. As shown in Table 4, two out of the three remaining sites showed improvements in surgery, axillary management, and radiation therapy. Chemotherapy scores showed large improvements in site 1 as well as site 3. Site 4 showed marginal improvement while site 2 showed a large decrease. Hormonal therapy, which started at relatively high baseline scores, proved difficult to improve, with only sites 1 and 3 showing any large increase.
Click to view | Table 4. Comparison of Baseline to Latest Round of CPV Scores by Areas of Care |
| Discussion | ▴Top |
Isolating practice variability from patient variability to untangle the causes of poor clinical care is a challenge for all quality improvement projects. In this study of four separate oncology systems, standardized virtual CPV patients removed patient variability to focus on provider practice variability and highlight opportunities to improve clinical decision making.
Serially engaging breast cancer providers with a validated clinical practice engagement and measurement tool markedly increased quality scores and adherence to clinical guidelines in the simulated patients. CPVs measured differences in clinical skill improvement and detected how fast improvements were made. The results indicate that CPV measurement was sensitive enough to accurately measure provider adherence to clinical pathways and were also responsive enough to detect meaningful improvements (or lack of improvement) over time. CPV measurement found a high degree of variability between and within sites that declined over time for DxTx and among certain subgroups. These results support the idea that direct, practice-based engagement of providers with proper learning tools can improve quality of practice and use of pathways.
When analyzing performance by domain, physical examination was consistently the highest score, presumably because it is the most straightforward area. The workup and DxTx domains demonstrated the lowest scores and the widest variability at baseline and also the greatest improvement over 9 - 18 months of CPV engagement. These are highly complex domains with multiple decision points, and most directly impact patient outcomes with important cost consequences for health systems, payers and, ultimately, patients. Notably, improvements in adherence to treatment guidelines has historically been difficult to effect [20]; that CPVs were able to identify these domains as opportunities for greatest change and drive the strongest improvements has important implications for improving both quality and cost.
Those who spent more time seeing patients had both higher quality scores and less variability in performance at baseline and by the end of the study. The expectation (unproven) was that providers who taught more might score higher (a marker for greater familiarity to guidelines) and/or have less variability (a marker for standardization within each site). That this was not demonstrated may be driven by a number of factors. First, providers who spend more time in clinic and see a consistent stream of patients could be more comfortable with simulated patient encounters, more familiar with evidence-based care, or more likely to recognize similar patients they have recently seen. Alternatively, those who spend more time teaching may be less likely to respond to feedback. The second supposition is somewhat worrying, as those with more teaching responsibilities are ones mentoring and modeling behavior for the next generation of clinicians. Further investigation of this is warranted.
This study looked at specific clinical areas of breast cancer care (surgical decisions, axillary management, radiation therapy, chemotherapy, and hormonal therapy) and found varied levels of improvement between sites. Chemotherapy is a complex clinical decision point in breast cancer care because multiple drug options, combinations and dosing regimens are available and decisions are made based on patient-, disease- and cost-related factors. The marked improvements seen at sites 1 and 3 show that, even in complex areas, measurement and feedback can improve decision making. Differences in baseline scores and improvement rates by site suggest that CPV quality scores can be used to direct performance improvement initiatives tailored to each organization.
To support practice change, physicians need the right tools to systematically examine their own practice performance [21]. Continuing medical education (CME) has been tasked with doing this, but a growing body of research has found that traditional CME in the quality improvement space can be irrelevant and ineffective at changing physician behavior [22], and results seldom involved reflection by the physician on their real learning needs and are often designed as passive add-ons to quality improvement activities [20, 23]. A 2010 Institute of Medicine report based on the analysis of 62 studies and 20 systematic reviews found that the “continuing education “system”, as it is structured today, is so deeply flawed that it cannot properly support the development of health professionals” [24].
Researchers have found physicians are unable to accurately self-assess their skills, and suggest external assessment, scoring and feedback would drive more effective professional development [25]. Others have found that physicians are often “not trained” to evaluate or use published guidelines and best practices [26]. Passive dissemination of information (e.g., publishing guidelines, reading peer review articles) is generally ineffective at changing practice and is unlikely to result in group-wide practice change when used alone [27]. Multifaceted interventions based on assessment of potential barriers to change are more likely to be effective than single interventions [26].
These frustrations about changing clinical practice have led to calls for better ways to engage clinicians and support high quality, high value care [5]. Physician engagement [28] is widely recognized as key to the success of nearly any health system initiative, and this extends naturally to any successful quality improvement programs [29]. Physicians identified as engaged in hospital quality improvement initiatives are much more likely to report successful experiences implementing quality improvement programs [21]. Methods that require active physician learning (e.g., one-on-one meetings, small-group workshops and programs tailored for a specific clinic) have been shown to most effectively change physician practice patterns to align with new clinical guidelines [5]. These, however, can be difficult and costly to scale.
Limitations to this study do exist. The sites that participated in this study were self-selected, and it may be that the providers at these sites were already primed for a quality improvement program. However, determination of how much of the leadership’s commitment was instilled in the providers prior to the study is difficult to measure, and the results give here may instead have been driven by the actual engagement process, which as noted above is necessary for successful implementation and adoption of a quality improvement program.
The importance of engagement in meaningful quality improvement work cannot be overemphasized, and the adult learning theory construct captures what is occurring in this area with CPVs. Disease-specific simulated patient vignettes (work relevant) that are open-ended and evidence-based (self-direction) and actively engage providers over multiple rounds of measurement, comparison, and feedback (motivation) are an effective strategy to improve clinical decision making and adherence guidelines (active learning). This multi-modal approach to changing physician behavior has the additional benefit of being efficiently scalable and applicable to multiple sites and organizations. Results from other studies show an increase in overall quality scores by the third round of intervention and permanent improvements after six rounds [30]. Documenting the impact of increased CPV quality scores on actual clinical practice and utilization is a priority for further study but evidence already exists that CPV use translates into better patient outcomes [2]. Beyond measuring quality (low) and variation (high), we found that engaging providers with their individual quality scores and delivering targeted feedback on opportunities to improve led to significant increases in overall quality and in the diagnosis and treatment among breast cancer providers.
Disclosure
Dr. Peabody developed the CPV® and is president of CPV Technologies, LLC, which owns the quality measurement tool used in the study.
Funding Source
No outside or specific funding was received for this study.
| References | ▴Top |
- IOM (Institute of Medicine). Delivering High-Quality Cancer Care: Charting a New Course for a System in Crisis. IOM, editor. Washington DC; 2013. p. 412.
- Peabody JW, Shimkhada R, Quimbo S, Solon O, Javier X, McCulloch C. The impact of performance incentives on child health outcomes: results from a cluster randomized controlled trial in the Philippines. Health Policy Plan. 2014;29(5):615-621.
doi pubmed - Uemura M, Morgan R, Jr., Mendelsohn M, Kagan J, Saavedra C, Leong L. Enhancing quality improvements in cancer care through CME activities at a nationally recognized cancer center. J Cancer Educ. 2013;28(2):215-220.
doi pubmed - James BC, Savitz LA. How Intermountain trimmed health care costs through robust quality improvement efforts. Health Aff (Millwood). 2011;30(6):1185-1191.
doi pubmed - Mostofian F, Ruban C, Simunovic N, Bhandari M. Changing physician behavior: what works? Am J Manag Care. 2015;21(1):75-84.
pubmed - Nyweide DJ, Lee W, Cuerdon TT, Pham HH, Cox M, Rajkumar R, Conway PH. Association of Pioneer Accountable Care Organizations vs traditional Medicare fee for service with spending, utilization, and patient experience. JAMA. 2015;313(21):2152-2161.
doi pubmed - Phelps G, Barach P. Why has the safety and quality movement been slow to improve care? Int J Clin Pract. 2014;68(8):932-935.
doi pubmed - Dowding D, Randell R, Gardner P, Fitzpatrick G, Dykes P, Favela J, Hamer S, et al. Dashboards for improving patient care: review of the literature. Int J Med Inform. 2015;84(2):87-100.
doi pubmed - Casalino L, Gillies RR, Shortell SM, Schmittdiel JA, Bodenheimer T, Robinson JC, Rundall T, et al. External incentives, information technology, and organized processes to improve health care quality for patients with chronic diseases. JAMA. 2003;289(4):434-441.
doi pubmed - Hoverman JR, Cartwright TH, Patt DA, Espirito JL, Clayton MP, Garey JS, Kopp TJ, et al. Pathways, outcomes, and costs in colon cancer: retrospective evaluations in two distinct databases. J Oncol Pract. 2011;7(3 Suppl):52s-59s.
doi pubmed - Rotter T, Kinsman L, James E, Machotta A, Gothe H, Willis J, Snow P, et al. Clinical pathways: effects on professional practice, patient outcomes, length of stay and hospital costs. Cochrane Database Syst Rev. 2010;3:CD006632.
doi - Barlow G, Nathwani D, Myers E, Sullivan F, Stevens N, Duffy R, Davey P. Identifying barriers to the rapid administration of appropriate antibiotics in community-acquired pneumonia. J Antimicrob Chemother. 2008;61(2):442-451.
doi pubmed - Majumdar SR, Simpson SH, Marrie TJ. Physician-perceived barriers to adopting a critical pathway for unity-acquired pneumonia. Jt Comm J Qual Saf. 2004;30(7):387-395.
pubmed - Knowles MS. The Modern Practice of Adult Education: From Pedagogy to Andragogy. 2nd ed. New York, NY: Cambridge Books; 1980.
- Russell SS. An overview of adult-learning processes. Urol Nurs. 2006;26(5):349-352, 370.
pubmed - Peabody JW, Luck J, Glassman P, Jain S, Hansen J, Spell M, Lee M. Measuring the quality of physician practice by using clinical vignettes: a prospective validation study. Ann Intern Med. 2004;141(10):771-780.
doi pubmed - Peabody JW, Liu A. A cross-national comparison of the quality of clinical care using vignettes. Health Policy Plan. 2007;22(5):294-302.
doi pubmed - Quimbo S, Peabody JW, Javier X, Shimkhada R, Solon O. Pushing on a String: How policy might encourage private doctors to compete with the public sector on the basis of quality. Econ Lett. 2011;110(2):101-103.
doi pubmed - DeMaria L, Acelajado MC, Luck J, Ta H, Chernoff D, Florentino J, Peabody JW. Variations and practice in the care of patients with rheumatoid arthritis: quality and cost of care. J Clin Rheumatol. 2014;20(2):79-86.
doi pubmed - Davis DA, Taylor-Vaisey A. Translating guidelines into practice. A systematic review of theoretic concepts, practical experience and research evidence in the adoption of clinical practice guidelines. CMAJ. 1997;157(4):408-416.
pubmed - Caverzagie KJ, Bernabeo EC, Reddy SG, Holmboe ES. The role of physician engagement on the impact of the hospital-based practice improvement module (PIM). J Hosp Med. 2009;4(8):466-470.
doi pubmed - Davis NL, Davis DA, Johnson NM, Grichnik KL, Headrick LA, Pingleton SK, Bower E, et al. Aligning academic continuing medical education with quality improvement: a model for the 21st century. Acad Med. 2013;88(10):1437-1441.
doi pubmed - Holmboe ES, Cassel C. Continuing medical education and maintenance of certification: essential links. Perm J. 2007;11(4):71-75.
doi pubmed - IOM (Institute of Medicine). Redesigning continuing education in the health professions. Washington, DC: The National Academies Press; 2010.
- Davis DA, Mazmanian PE, Fordis M, Van Harrison R, Thorpe KE, Perrier L. Accuracy of physician self-assessment compared with observed measures of competence: a systematic review. JAMA. 2006;296(9):1094-1102.
doi pubmed - Grimshaw JM, Eccles MP, Walker AE, Thomas RE. Changing physicians' behavior: what works and thoughts on getting more things to work. J Contin Educ Health Prof. 2002;22(4):237-243.
doi pubmed - Grol R. Successes and failures in the implementation of evidence-based guidelines for clinical practice. Med Care. 2001;39(8 Suppl 2):II46-54.
doi - Spurgeon P, Mazelan PM, Barwell F. Medical engagement: a crucial underpinning to organizational performance. Health Serv Manage Res. 2011;24(3):114-120.
doi pubmed - Wardhani V, Utarini A, van Dijk JP, Post D, Groothoff JW. Determinants of quality management systems implementation in hospitals. Health Policy. 2009;89(3):239-251.
doi pubmed - Quimbo S, Wagner N, Florentino J, Solon O, Peabody J. Do Health Reforms to Improve Quality Have Long-Term Effects? Results of a Follow-Up on a Randomized Policy Experiment in the Philippines. Health Econ. 2016;25(2):165-177.
doi pubmed
This is an open-access article distributed under the terms of the Creative Commons Attribution-NonCommercial 4.0 International License, which permits unrestricted non-commercial use, distribution, and reproduction in any medium, provided the original work is properly cited.
Journal of Clinical Medicine Research is published by Elmer Press Inc.